Date: Fri, Dec 19 2025 | 12:45 PM GMT
The broader cryptocurrency market is showing relative strength despite concerns around the Japan rate hike. Cooling U.S. inflation has helped both Bitcoin (BTC) and Ethereum (ETH) hold in the green, and this stability is beginning to spill over into select altcoins, including Stellar (XLM).
XLM has posted modest gains today, but beyond the short-term price move, the daily chart is starting to reveal an emerging technical structure that could set the stage for a more meaningful recovery if key levels continue to hold.
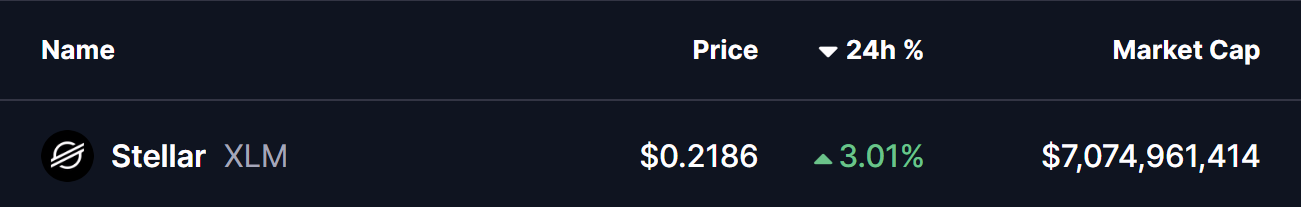
Source: Coinmarketcap
Harmonic Pattern Signals Potential Upside
On the daily timeframe, XLM appears to be forming a Bearish Cypher harmonic pattern — a setup that often generates upside momentum during its final CD leg before price reaches the Potential Reversal Zone (PRZ).
The pattern began at point X near the $0.3113 region, where XLM topped out before entering a sharp corrective phase. Price then declined into point A, followed by a rebound toward point B. From there, XLM rolled over again and extended lower into point C around the $0.2029 area, completing the core structure of the pattern.
Since tagging this low, XLM has started to stabilize and grind higher, currently trading near the $0.2188 level. This slow but steady recovery suggests that selling pressure may be fading, with buyers beginning to defend the recent lows more aggressively.
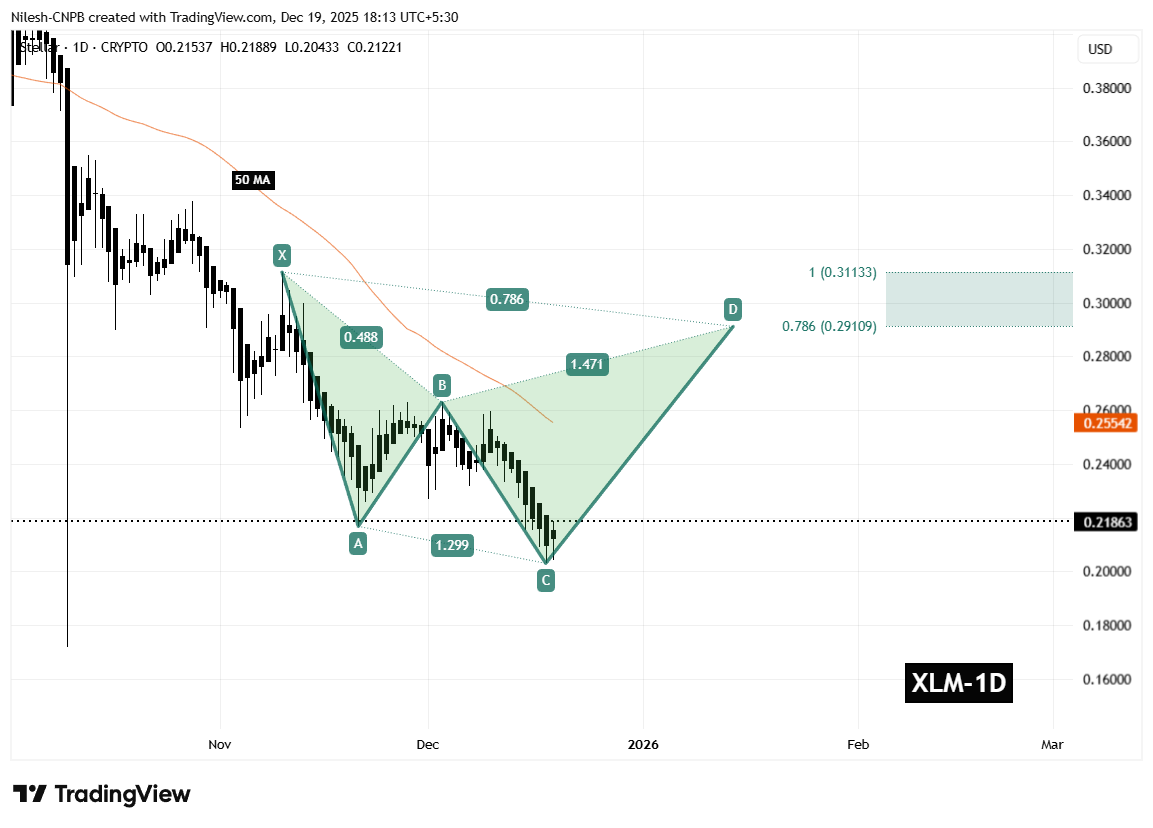
Stellar (XLM) Daily Chart /Coinsprobe (Source: Tradingview)
A key technical factor aligning with this structure is the 50-day moving average, currently positioned near $0.2554. This moving average has consistently acted as dynamic resistance throughout the downtrend and represents an important hurdle for bulls to overcome in the near term.
What’s Next for XLM?
In the short term, the most critical level to monitor is the C-leg support around $0.2029. As long as XLM holds above this zone, the harmonic pattern remains valid and the bullish CD-leg scenario stays intact.
If price continues to build strength from this base, the next major test will be a reclaim of the 50-day moving average near $0.2554. A decisive break and close above this level would signal improving momentum and could accelerate upside continuation.
Based on the harmonic structure, the projected upside targets sit within the Potential Reversal Zone, defined between the 0.786 Fibonacci extension near $0.2910 and the 1.0 extension around $0.3113. Reaching this zone would represent a potential upside of roughly 40–45% from current price levels, making it a key area where profit-taking or stronger resistance could emerge.
On the downside, failure to hold above the $0.2029 support would significantly weaken the bullish setup. A breakdown below this level could invalidate the harmonic structure and expose XLM to deeper downside pressure before any sustainable recovery attempt develops.
For now, the chart suggests Stellar is sitting at an important technical crossroads. While confirmation is still needed, the presence of a well-defined harmonic pattern indicates that a short- to medium-term bounce remains a realistic possibility if buyers continue to defend current levels and reclaim key resistance zones.
Disclaimer: The views and analysis presented in this article are for informational purposes only and reflect the author’s perspective, not financial advice. Technical patterns and indicators discussed are subject to market volatility and may or may not yield the anticipated results. Investors are advised to exercise caution, conduct independent research, and make decisions aligned with their individual risk tolerance.
Disclaimer: The information on this page may come from third parties and does not represent the views or opinions of Gate. The content displayed on this page is for reference only and does not constitute any financial, investment, or legal advice. Gate does not guarantee the accuracy or completeness of the information and shall not be liable for any losses arising from the use of this information. Virtual asset investments carry high risks and are subject to significant price volatility. You may lose all of your invested principal. Please fully understand the relevant risks and make prudent decisions based on your own financial situation and risk tolerance. For details, please refer to
Disclaimer.
Related Articles
XRP Price Growth Could Drive Bank Adoption, Says Ripple CTO Emeritus
David Schwartz's insights on XRP suggest that a higher price enhances its efficiency for banks in cross-border payments, requiring fewer tokens for transactions. This can lower liquidity pressure, reduce operational costs, and improve capital efficiency, making XRP a more viable option in the evolving global payments landscape.
CryptometerIo41m ago
Michael Burry’s warning siren in the crypto market..."A downward spiral of collateral collapse" is coming
Michael Burry’s warning siren in the crypto market..."Collateral liquidation vicious cycle" is coming
SuperCryptoWahaha6666652m ago
UNI and AAVE are first in line! Analyst: The current draft crypto market law could severely damage the DeFi yield myth
10x Research warns that if the CLARITY Act is passed, it will ban stablecoin balance yield, potentially impacting DeFi protocols and related tokens. Returns would be funneled back to the traditional financial system, leading to reduced market competition, and many DeFi projects will face strict regulation.
CryptoCity53m ago
XRP Today’s News: Arizona Proposes Legislation to Include XRP as a Treasury Reserve Asset
The Arizona House Rules Committee unanimously passed the SB1649 bill, establishing a Digital Assets Strategic Reserve Fund that puts digital assets such as XRP under the management of the Department of the Treasury, and allows revenue to be generated through methods such as staking. If the bill passes, it will become the first U.S. state to officially recognize XRP as a fiscal reserve asset. XRP is currently trading at $1.28 and faces challenges from technical support and resistance.
MarketWhisper2h ago
Bittensor (TAO) Is Up 140% in 6 Weeks, But Data Shows Retail Is Missing the Big AI Rally
Bittensor has recorded a 140% price increase over the past six weeks, including a 105% rise since March 8.
The latest price action has pushed it to the 26th-largest cryptocurrency by market capitalization, according to new data from Santiment.
AI Tokens Heat Up
-----------------
The rally comes a
CryptoPotato3h ago
Why is Bitcoin down today? Trump’s “Stone Age” comments trigger a $440 million liquidation
Trump, in a speech on April 2, warned Iran, causing market risk sentiment to contract sharply; Bitcoin fell by about 4%, hitting a low of $65,789. Rising oil prices and a strengthening dollar index intensified macro pressure, further impacting the market. From a technical perspective, Bitcoin may face a key support level at $64,000.
MarketWhisper3h ago
