Date: Fri, Dec 19 2025 | 12:45 PM GMT
The broader cryptocurrency market is showing relative strength despite concerns around the Japan rate hike. Cooling U.S. inflation has helped both Bitcoin (BTC) and Ethereum (ETH) hold in the green, and this stability is beginning to spill over into select altcoins, including Stellar (XLM).
XLM has posted modest gains today, but beyond the short-term price move, the daily chart is starting to reveal an emerging technical structure that could set the stage for a more meaningful recovery if key levels continue to hold.
Source: Coinmarketcap
Harmonic Pattern Signals Potential Upside
On the daily timeframe, XLM appears to be forming a Bearish Cypher harmonic pattern — a setup that often generates upside momentum during its final CD leg before price reaches the Potential Reversal Zone (PRZ).
The pattern began at point X near the $0.3113 region, where XLM topped out before entering a sharp corrective phase. Price then declined into point A, followed by a rebound toward point B. From there, XLM rolled over again and extended lower into point C around the $0.2029 area, completing the core structure of the pattern.
Since tagging this low, XLM has started to stabilize and grind higher, currently trading near the $0.2188 level. This slow but steady recovery suggests that selling pressure may be fading, with buyers beginning to defend the recent lows more aggressively.
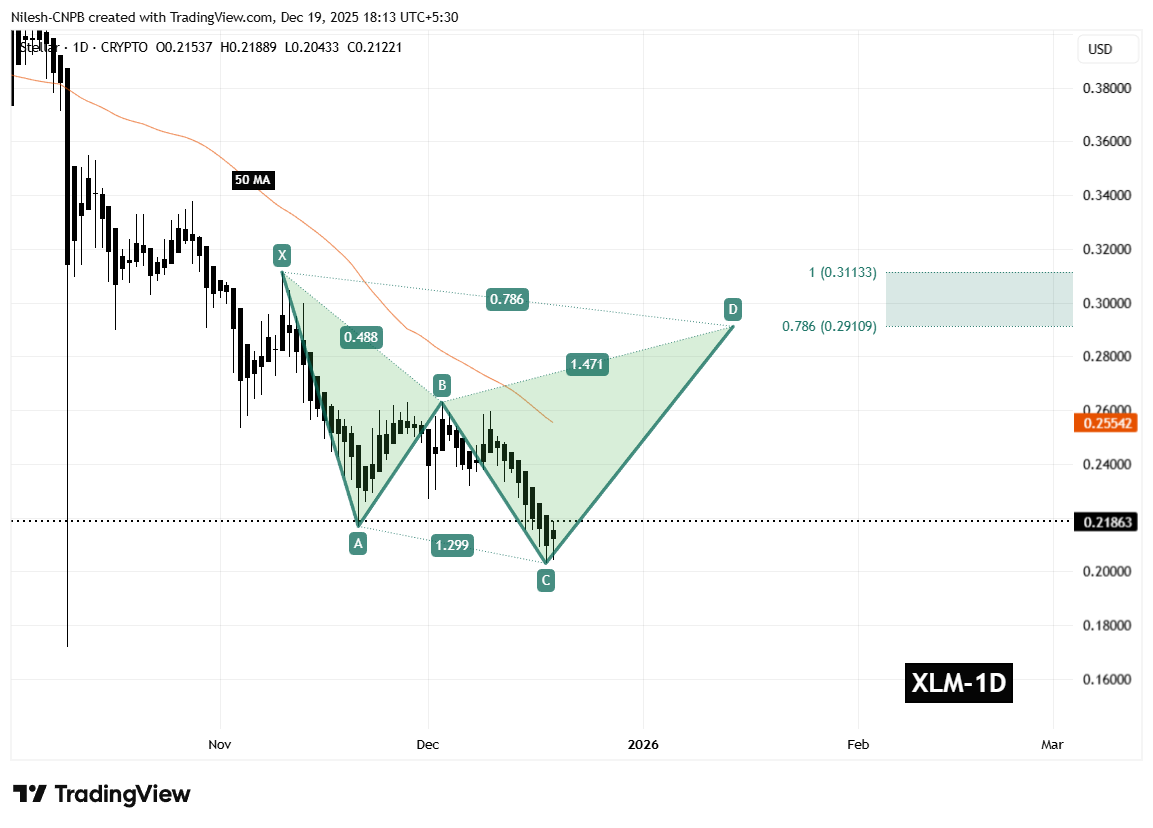
Stellar (XLM) Daily Chart /Coinsprobe (Source: Tradingview)
A key technical factor aligning with this structure is the 50-day moving average, currently positioned near $0.2554. This moving average has consistently acted as dynamic resistance throughout the downtrend and represents an important hurdle for bulls to overcome in the near term.
What’s Next for XLM?
In the short term, the most critical level to monitor is the C-leg support around $0.2029. As long as XLM holds above this zone, the harmonic pattern remains valid and the bullish CD-leg scenario stays intact.
If price continues to build strength from this base, the next major test will be a reclaim of the 50-day moving average near $0.2554. A decisive break and close above this level would signal improving momentum and could accelerate upside continuation.
Based on the harmonic structure, the projected upside targets sit within the Potential Reversal Zone, defined between the 0.786 Fibonacci extension near $0.2910 and the 1.0 extension around $0.3113. Reaching this zone would represent a potential upside of roughly 40–45% from current price levels, making it a key area where profit-taking or stronger resistance could emerge.
On the downside, failure to hold above the $0.2029 support would significantly weaken the bullish setup. A breakdown below this level could invalidate the harmonic structure and expose XLM to deeper downside pressure before any sustainable recovery attempt develops.
For now, the chart suggests Stellar is sitting at an important technical crossroads. While confirmation is still needed, the presence of a well-defined harmonic pattern indicates that a short- to medium-term bounce remains a realistic possibility if buyers continue to defend current levels and reclaim key resistance zones.
Disclaimer: The views and analysis presented in this article are for informational purposes only and reflect the author’s perspective, not financial advice. Technical patterns and indicators discussed are subject to market volatility and may or may not yield the anticipated results. Investors are advised to exercise caution, conduct independent research, and make decisions aligned with their individual risk tolerance.
Disclaimer: The information on this page may come from third parties and does not represent the views or opinions of Gate. The content displayed on this page is for reference only and does not constitute any financial, investment, or legal advice. Gate does not guarantee the accuracy or completeness of the information and shall not be liable for any losses arising from the use of this information. Virtual asset investments carry high risks and are subject to significant price volatility. You may lose all of your invested principal. Please fully understand the relevant risks and make prudent decisions based on your own financial situation and risk tolerance. For details, please refer to
Disclaimer.
Related Articles
英伟达股价承压175美元,技术面和期权信号显示下行风险
英伟达股价近期在175美元附近徘徊,连续下跌且技术指标显示卖压加剧。资金流向及期权市场均偏向空头,171美元为关键支撑位,若跌破可能进一步探低,投资者需关注市场动向。
GateNews1m ago
三大“叙事障碍”或限制Strategy比特币扩张:集中风险、量子威胁与多元化疑虑
Strategy有望成为最大企业比特币持有者,但面临集中风险、量子计算威胁及投资组合多元化问题,可能影响其增持能力。分析师指出这是关键关注点,然而没有迹象显示会引发大规模风险。
GateNews3m ago
TAO暴涨18%重返300美元:空头挤压结束,关键阻力位或决定下一步方向
Bittensor(TAO)价格于3月25日强劲反弹至308美元,涨幅18%。此次上涨主要受空头挤压推动,但资金流入强度减弱,显示出看跌背离。当前价格逼近关键阻力区,后续走势将取决于能否突破310美元和现货资金的入场。
GateNews4m ago
Mining 1 Coin Loses $20,000! Bitcoin Miners Flee En Masse, "Mining Difficulty" Plummets 7.8%
Bitcoin mining industry is facing severe challenges as coin prices decline and energy costs rise, with mining costs soaring to $88,000, causing miners to lose nearly $20,000 per bitcoin mined. International oil prices and geopolitical risks intensify financial pressure on miners. Hash rate decline and extended block time indicate miners are exiting the market, driving a sell-off wave that further impacts price structure. To survive, mining companies are turning to AI and high-performance computing to seek new revenue streams.
区块客23m ago
PEPE Price Slides as Weak Momentum Signals Further Downside
The Pepe token displays weakening momentum with bearish sentiment prevalent in short-term trading. Oversold conditions fail to ignite recovery, indicating weak demand and cautious trader behavior, while price pressures near the lower Bollinger Band highlight ongoing downside risks.
CryptoFrontNews27m ago
Hyperliquid Fees Surge as HYPE Lags Valuation Growth
Key Insights:
Hyperliquid generated $14 million in weekly fees, reflecting strong derivatives demand and positioning the protocol among the top revenue drivers in decentralized finance.
HyperEVM recorded 55 percent transaction growth and 25% user expansion, highlighting rapid adoption and st
CryptoFrontNews32m ago
