
Date: Sun, Dec 21 2025 | 08:56 AM GMT
The broader cryptocurrency market has remained under pressure over the past several weeks, following the sharp sell-off that began on October 10. That corrective phase dragged Ethereum (ETH) down by nearly 23% over the last 60 days and weighed heavily on overall market sentiment. While many altcoins have struggled to stabilize, Quant (QNT) has shown relative resilience, posting only a modest decline and holding above a historically important support zone.
From a technical perspective, the daily chart suggests that QNT may be approaching a critical decision point, with price action forming a recognizable structure that could influence its next directional move.
Source: Coinmarketcap
Head and Shoulders Pattern Takes Shape
On the daily timeframe, QNT appears to be carving out a head and shoulders formation, a well-known pattern that often signals a potential trend shift once the neckline is tested. Earlier in the structure, QNT formed the left shoulder before rallying sharply to its head near the $100 region. From there, price reversed lower and slid back toward the neckline, located around the $70 support zone.
This $70 area has proven to be a strong demand zone in the past, repeatedly attracting buyers and preventing deeper declines. The recent move into this region was met with a noticeable reaction, as reflected by the long lower wick on the chart. That rejection from support pushed price back toward the $78 level, suggesting that buyers are actively defending the neckline and potentially forming the right shoulder of the pattern.
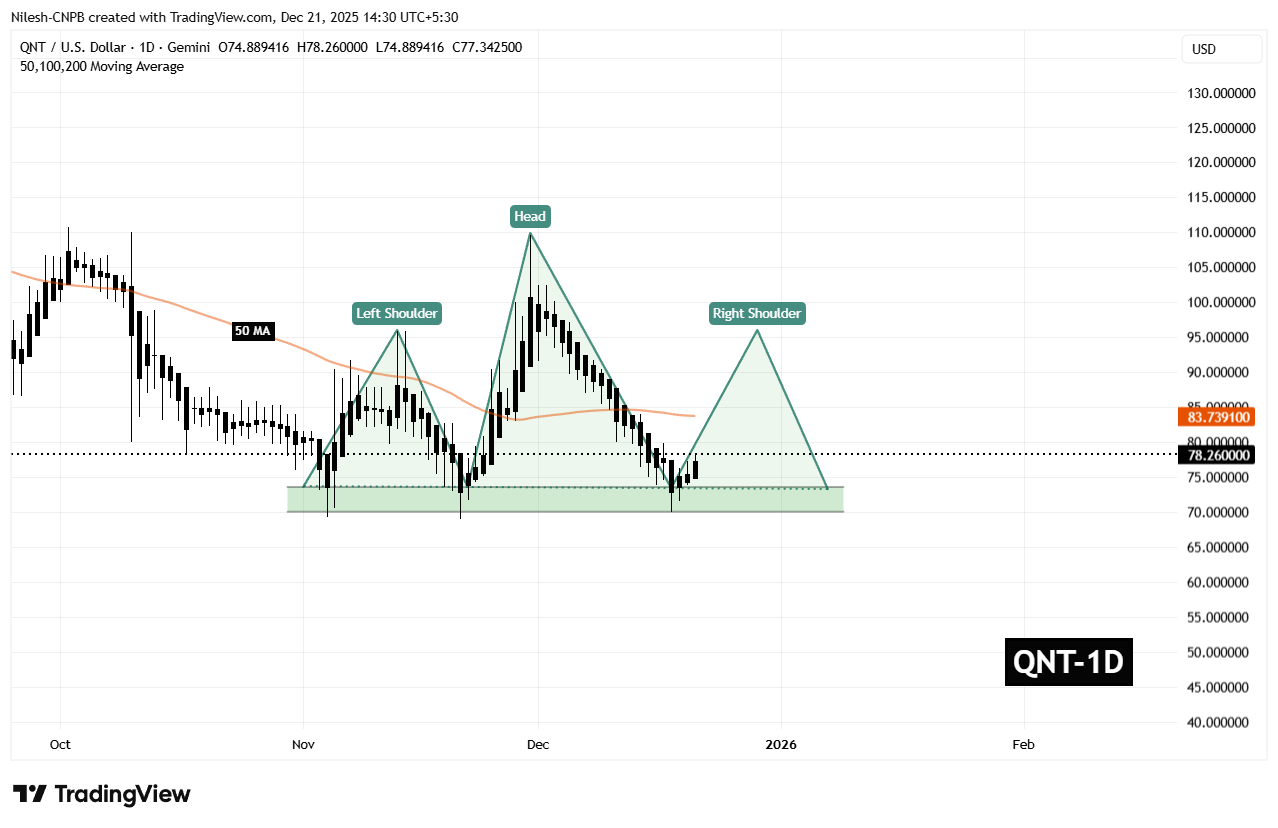
Quant (QNT) Daily Chart/Coinsprobe (Source: Tradingview)
The behavior around this zone is critical. A successful defense of the neckline often opens the door for a relief rally, especially if broader market conditions stabilize.
What’s Next for QNT?
For bullish momentum to build, QNT needs to reclaim the 50-day moving average, currently sitting near $83.73. This level now acts as a key short-term resistance, and a daily close above it would signal a shift in momentum back in favor of buyers.
If that recovery unfolds, the chart points toward a potential move into the $95.90 region. Such a move would represent a rebound of roughly 22% from current levels and align with the typical reaction seen during the right-shoulder phase of this pattern. A rally of this nature would not only ease recent selling pressure but also place QNT back into a more neutral technical posture.
That said, the setup remains delicate. If the $70 neckline support fails to hold on a sustained basis, the head and shoulders structure would remain bearish, opening the door to further downside and extending the corrective phase. For now, all eyes remain on how price behaves around this key support and whether buyers can regain control above the moving average.
Disclaimer: The views and analysis presented in this article are for informational purposes only and reflect the author’s perspective, not financial advice. Technical patterns and indicators discussed are subject to market volatility and may or may not yield the anticipated results. Investors are advised to exercise caution, conduct independent research, and make decisions aligned with their individual risk tolerance.
Disclaimer: The information on this page may come from third parties and does not represent the views or opinions of Gate. The content displayed on this page is for reference only and does not constitute any financial, investment, or legal advice. Gate does not guarantee the accuracy or completeness of the information and shall not be liable for any losses arising from the use of this information. Virtual asset investments carry high risks and are subject to significant price volatility. You may lose all of your invested principal. Please fully understand the relevant risks and make prudent decisions based on your own financial situation and risk tolerance. For details, please refer to
Disclaimer.
Related Articles
Trader Eugene: Switched to long positions, multiple altcoins showing arc bottom formations
Trader Eugene Ng Ah Sio stated on March 16 that he would shift to a long position, believing that despite weakening global risk assets, the crypto market is performing strongly. He pointed out that the probability of a short-term rally is high and expects Bitcoin breaking through $74,000 to drive a market-wide recovery.
GateNews9m ago
XRP Price Breaks Through Key Resistance Level to $1.48, Trading Volume Surges Over 250%
On March 16, XRP price broke through the consolidation zone, rising rapidly from approximately $1.41 to $1.4798, with trading volume increasing over 250%. The current price is stabilizing above $1.4550, and technical analysis shows the next resistance level at $1.48 to $1.50. On-chain activity is also growing, indicating improved market sentiment and increased activity. Key support levels are at $1.43 to $1.44.
GateNews10m ago
Bitcoin Surges to Local High of 74,000 USD, US-Iran Conflict and Oil Rally Drive Crypto Market's 320 Billion Dollar Spike
Bitcoin's price briefly surged to $74,451 on March 16, reaching a 40-day high, influenced by US-Iran conflicts and rising oil prices. The market has gained over $320 billion in total, but uncertainties still exist. Analysts suggest dollar-cost averaging between $60,000 and $70,000. Investors should exercise caution to manage potential risks.
GateNews12m ago
XRP Trading Volumes Fall 58% in 24 Hours, Despite Which the Altcoin Price Continues to Rise
XRP trading volumes fall 58% in 24 hours.
Despite this, the altcoin price continues to rise at a steady pace.
This bodes well for the likelihood of a possible XRP pump.
The previous few days have led to what looks to be a steady recovery phase for the crypto market. Presently, the price
CryptoNewsLand13m ago
Bitcoin Holds Strong at $70,000! On-Chain Data Reveals "Collective Selling Wave," Retail Investors Emerge as Biggest Selling Pressure
Under Middle East geopolitical tensions, Bitcoin faced widespread selling pressure, particularly from retail holders. According to Glassnode data, the market is experiencing heavy selling pressure, with the accumulated trend score declining to 0.04, indicating that retail and small-to-medium investors are reducing their positions significantly. Despite this, Bitcoin's resilience against the decline has surprised market observers.
区块客19m ago
Ethereum Breaks Through $2,200 Mark: ETF Inflows and Institutional Buying Drive ETH Strong Rebound
Ethereum (ETH) price broke through $2,200 following a recent rebound, with intraday gains of approximately 4.1%. ETF inflows and institutional buying support the rally, with key resistance levels at $2,250-$2,320. If it breaks through $2,300-$2,400, it could potentially point toward $2,500. Overall, this shows Ethereum's market recovery potential.
GateNews23m ago
