
Date: Sun, Dec 21 2025 | 12:15 PM GMT
The broader cryptocurrency market is showing relative strength over the weekend, with both Bitcoin (BTC) and Ethereum (ETH) trading in the green. This stability in the majors has helped lift sentiment across the altcoin space, and Kaspa (KAS) is beginning to respond positively.
KAS is up more than 4% on the day, and more importantly, its recent price action is starting to outline a clear technical structure. The 4-hour chart suggests that a harmonic pattern is developing, hinting that KAS could be setting up for another upside attempt if key levels are reclaimed.
Source: Coinmarketcap
Harmonic Pattern Taking Shape
On the 4-hour timeframe, KAS appears to be forming a Bearish ABCD harmonic pattern. Despite the bearish label, this setup often delivers a strong bullish CD-leg before price reaches the Potential Reversal Zone (PRZ). This interim rally is typically the most aggressive phase of the structure, and that is the move currently unfolding.
The pattern began with a sharp advance from point A near $0.0360 to point B, marking KAS’s initial impulse higher. This was followed by a corrective pullback into point C around $0.0400, where downside momentum stalled and buyers stepped in decisively. The defense of this level suggests that selling pressure is weakening and that demand is beginning to build.
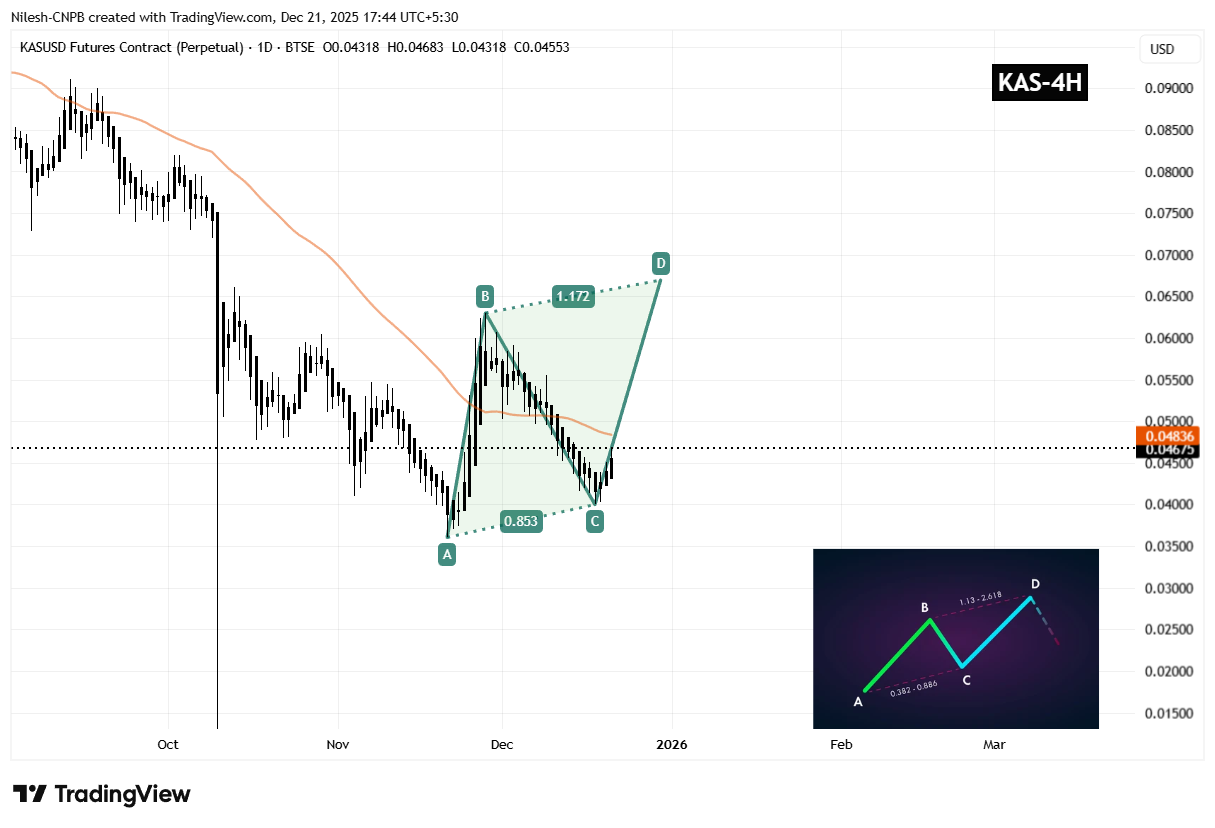
Kaspa (KAS) 4H Chart/Coinsprobe (Source: Tradingview)
Since bouncing from point C, KAS has pushed back toward the $0.046–$0.047 region, signaling the early stages of the CD-leg. This recovery phase indicates improving short-term momentum as the market tests overhead resistance.
A key technical obstacle now lies at the 50-period moving average, currently near $0.0484. This level has acted as dynamic resistance throughout the recent downtrend, and price is now compressing just below it. A clean breakout and sustained close above the 50 MA would be an important confirmation that bulls are regaining control and that the harmonic structure is progressing as expected.
What’s Next for KAS?
If buyers can drive KAS above the 50 MA and maintain momentum, the next upside objective aligns with the harmonic PRZ near the 1.17 Fibonacci extension around $0.0670. Reaching this zone would complete the ABCD pattern and represent a potential upside of roughly 40%–45% from current levels.
That said, the bullish scenario remains conditional. A failure to break above the 50 MA, followed by a drop back below the C-leg support near $0.0400, would weaken the harmonic setup and reopen the door for renewed bearish pressure.
For now, the structure on the chart suggests KAS is at a technically important inflection point. As long as price continues to hold above recent lows and challenge key resistance levels, the path of least resistance may remain tilted to the upside in the short term.
Disclaimer: The views and analysis presented in this article are for informational purposes only and reflect the author’s perspective, not financial advice. Technical patterns and indicators discussed are subject to market volatility and may or may not yield the anticipated results. Investors are advised to exercise caution, conduct independent research, and make decisions aligned with their individual risk tolerance.
Disclaimer: The information on this page may come from third parties and does not represent the views or opinions of Gate. The content displayed on this page is for reference only and does not constitute any financial, investment, or legal advice. Gate does not guarantee the accuracy or completeness of the information and shall not be liable for any losses arising from the use of this information. Virtual asset investments carry high risks and are subject to significant price volatility. You may lose all of your invested principal. Please fully understand the relevant risks and make prudent decisions based on your own financial situation and risk tolerance. For details, please refer to
Disclaimer.
Related Articles
Bitcoin, ether, solana slide further as Trump threatens to hit Iran 'extremely hard'
Bitcoin and major cryptocurrencies fell sharply after Trump's address threatened escalated military action against Iran, reversing a previous rally. The ongoing conflict continues to create volatility in the market. Despite historical April gains, optimism is tempered by geopolitical tensions.
CoinDesk49m ago
Trump makes a tough statement to pressure Iran, Bitcoin falls below a key level, and the crypto market is under pressure again
Driven by the impact of Trump’s hardline remarks toward Iran, the crypto market weakened, with Bitcoin and Ethereum falling to $66,609 and $2,056, respectively. Market panic sentiment intensified, and the Fear & Greed Index dropped to 8. War risk pushed energy prices up, suppressing the valuations of risk assets, and in the short term volatility in crypto assets could increase.
GateNews58m ago
Trump’s “Stone Age” speech threatens to seriously hit the market; Bitcoin’s price gives back its gains
U.S. President Trump threatened in a speech to launch even harsher strikes against Iran. The market reacted sharply: Bitcoin and the stock market fell significantly, and oil prices surged. Iran has no intention of backing down and is pushing for legislation on permanent tolls, showing that tensions between the two countries have not eased. The market believes a ceasefire cannot be achieved quickly.
MarketWhisper1h ago
Trump says the Strait of Hormuz will be made “naturally open,” and the market shows disagreement through selling off
Trump expressed optimism in his speech about Iran’s military actions, saying the Strait of Hormuz will be “naturally open,” but he did not provide a specific plan, leading markets to sell off. Iran, in turn, made no concessions and plans to pass legislation to collect transit fees, further increasing uncertainty. The market reaction shows that risk assets underwent broad repricing.
MarketWhisper1h ago
Monad locks in $350 million, and its low fee rate and FDV being halved release a cautious signal
Monad blockchain reached a total value locked (TVL) of $355 million within about four months, setting a record for rapid growth, but its daily transaction fees are less than $3,000, indicating a disconnect between locked capital and real trading activity. At the same time, the fully diluted valuation of the MON token fell from $4.7 billion to about $2.2 billion, reflecting the market’s lack of confidence in its continued ability to attract users.
MarketWhisper1h ago
Pi Network RPC server startup, supply pressure obstructs a technical rebound for PI
Pi Network announced that its testnet remote procedure call (RPC) servers are now live, laying the groundwork for building a smart contract ecosystem. Although this news is seen as a positive, the core team’s selling of more than 21.8 million PI tokens, along with the ongoing supply pressure stemming from user top-ups, has still exerted downside pressure on the market. Technical analysis shows that the support level for the PI token is $0.1736; the future price action needs to be closely watched.
MarketWhisper2h ago
