
Date: Mon, Dec 22, 2025 | 10:20 AM GMT
The broader altcoin market has remained stuck in choppy and uncertain price action over the past several weeks. The ongoing correction dragged Ethereum (ETH) lower by more than 22% over the last 60 days, reinforcing a short-term bearish tone across the altcoin space — and **Chainlink (LINK) **has not been spared.
LINK is down over 27% during the same period, reflecting persistent selling pressure and weak sentiment. However, beneath the surface, a combination of rising whale accumulation and a developing technical structure on the daily chart suggests that downside momentum may be slowing, potentially setting the stage for a rebound.
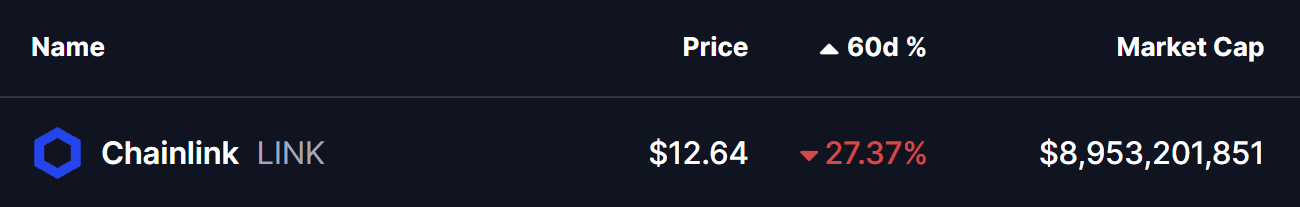
Source: Coinmarketcap
Whale Accumulation Surges Beneath the Sell-Off
Despite LINK’s recent underperformance, large holders appear to be positioning quietly. According to data shared by Lookonchain, over the past three days, 11 newly created wallets have withdrawn approximately 1.567 million LINK — worth nearly $19.8 million — from Binance.
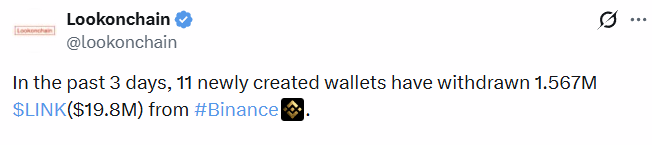
LINK Token Whale Accumulation/Source: @lookonchain (X)
This type of exchange outflow is typically associated with accumulation rather than distribution, as tokens moved off exchanges are less likely to be sold in the near term. While whale activity alone does not guarantee an upside move, it often appears during market phases where smart money begins building longer-term positions amid broader fear and uncertainty.
Harmonic Pattern Hints at Potential Upside
From a technical perspective, LINK’s daily chart is beginning to outline a Bearish Bat harmonic pattern. While the name may sound negative, this structure often produces a strong bullish move during the CD leg before reaching its final completion zone.
The pattern began near Point X around $19.04, followed by a sharp decline to Point A, which marked the initial capitulation move. LINK then rebounded toward Point B, before undergoing a deeper corrective pullback into Point C near $11.73, where buyers stepped in decisively.
Since forming this higher-quality low, LINK has stabilized and rebounded toward the $12.66 region, signaling the early development of the CD leg. This phase is typically where momentum starts to accelerate if the pattern remains valid.
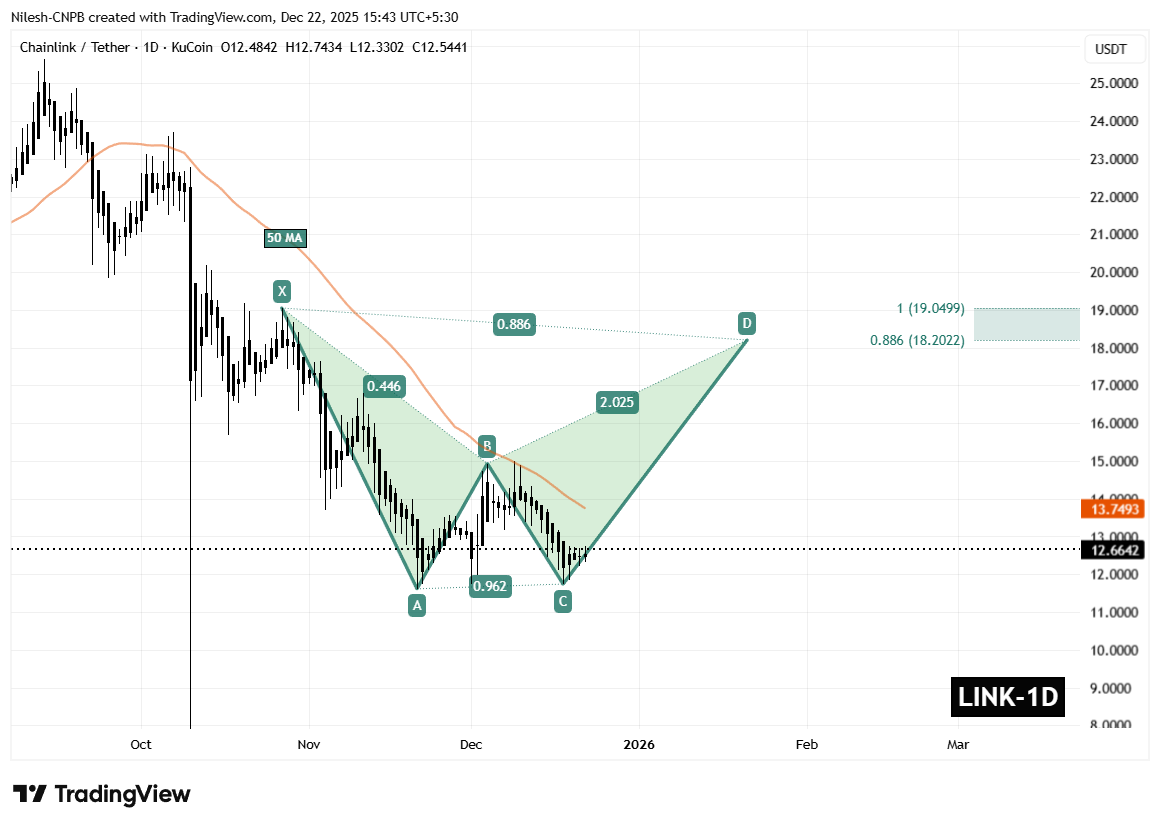
Chainlink (LINK) Daily Chart/Coinsprobe (Source: Tradingview)
Price is now trading just below the 50-day moving average, currently positioned near $13.74. This level is acting as short-term dynamic resistance, and the chart shows price compressing beneath it. A daily close above the 50 MA would be an important technical confirmation, signaling that buyers are regaining control and that the harmonic expansion is gaining traction.
What’s Next for LINK?
If bulls manage to reclaim and hold above the 50-day MA, the harmonic structure projects a potential upside move toward the Potential Reversal Zone (PRZ) between $18.20 and $19.04. This area aligns closely with the 0.886 and 1.0 Fibonacci extensions, which often act as completion zones for Bearish Bat patterns. Reaching this zone would represent a meaningful recovery from current levels and a clear shift in short-term momentum.
That said, the bullish setup remains conditional. A failure to hold the C-level support near $11.73 would invalidate the harmonic structure and could reopen the door to further consolidation or renewed downside pressure before any sustainable recovery takes place.
For now, LINK sits at an important technical crossroads. With whale accumulation increasing and price stabilizing above a well-defined support base, the coming sessions may prove critical in determining whether this setup evolves into a broader upside move or remains a temporary relief rally.
Disclaimer: The views and analysis presented in this article are for informational purposes only and reflect the author’s perspective, not financial advice. Technical patterns and indicators discussed are subject to market volatility and may or may not yield the anticipated results. Investors are advised to exercise caution, conduct independent research, and make decisions aligned with their individual risk tolerance.
Disclaimer: The information on this page may come from third parties and does not represent the views or opinions of Gate. The content displayed on this page is for reference only and does not constitute any financial, investment, or legal advice. Gate does not guarantee the accuracy or completeness of the information and shall not be liable for any losses arising from the use of this information. Virtual asset investments carry high risks and are subject to significant price volatility. You may lose all of your invested principal. Please fully understand the relevant risks and make prudent decisions based on your own financial situation and risk tolerance. For details, please refer to
Disclaimer.
Related Articles
XRP Reclaims $1.40 Mark as Price Jumps 6%, Where Is Price Heading? - U.Today
XRP recently surpassed the $1.40 resistance level, driven by a 12.92% spike in trading volume to $2.63 billion. Renewed interest, notably due to a partnership with Mastercard, may help sustain upward momentum, with potential targets of $1.50 and $2. However, a drop below $1.39 could negate this breakout.
UToday27m ago
PI Jumps 16% After V20.2 Upgrade and AI Node Plans
Pi Network completed the V20.2 upgrade, ensuring node alignment and network stability for all operators.
AI node experiments tested decentralized computing, using spare node capacity to handle real AI tasks.
PI price jumped 16%, breaking resistance at $0.23, eyeing $0.28 as key target.
P
CryptoNewsLand1h ago
"Seeking a Sword by Marking a Boat" style coin price predictions go viral: the practical logic and flaws of mystical prophecies
Author: Frank, PANews
Whenever the market enters a confusing phase of stagnation, someone attempts to predict the next trend using a "cutting the cord at the boat" style of historical retrospection method. In such circumstances, people often see from these theories and charts that history is repeating itself, and seem to automatically overlap and verify future market movements with a certain period in the past.
This coincidence appears to have a magical effect and is often verified. Some bloggers claim that the accuracy rate of this type of prediction can reach 75%~80%.
Does this "cutting the cord at the boat" style price prediction that repeatedly goes viral on social media actually help the market identify phases, or is it packaging noise as prophecy?
From "Tick Fractals" to "History Rhymes"
The peak operation regarding the prediction of a market top in October 2025 comes from an analyst named CryptoBullet, who created a method called "tick
PANews1h ago
Bitcoin Holds Strong at $70,000! On-Chain Data Reveals "Collective Selling Wave," Retail Investors Emerge as Biggest Selling Pressure
Under Middle East geopolitical tensions, Bitcoin faced widespread selling pressure, particularly from retail holders. According to Glassnode data, the market is experiencing heavy selling pressure, with the accumulated trend score declining to 0.04, indicating that retail and small-to-medium investors are reducing their positions significantly. Despite this, Bitcoin's resilience against the decline has surprised market observers.
区块客1h ago
Bitcoin Early Warning of Stock Market Risk? Global Stock Market Turbulence Intensifies After BTC Drops to $60,000
Recently, analysts have pointed out that Bitcoin's price movements often lead traditional risk assets, reflecting the weakness in global stock markets. After experiencing volatility, Bitcoin is currently stabilizing around $70,000, with market sentiment being affected by geopolitical tensions and rising oil prices. Historical data shows that Bitcoin often exhibits signs of peaking before stock market corrections, and investors are beginning to regard it as an important indicator for monitoring risk asset sentiment.
GateNews1h ago
Analyst: Bitcoin Has Transitioned from Distribution Phase to Accumulation Phase, Selling Pressure Drops to One-Sixth of Cycle Average
CryptoQuant analysts indicate that the market is currently in a neutral accumulation phase, with selling pressure dropping to historic lows, but may face long-term consolidation risks, requiring attention to the lack of price catalysts.
GateNews1h ago