
Date: Fri, Jan 02, 2026 | 09:15 AM GMT
The broader cryptocurrency market has started the new year on a stable footing, with both Bitcoin (BTC) and Ethereum (ETH) trading slightly higher and posting gains of over 1.5%. This modest strength across major assets has provided breathing room for risk-on sentiment, allowing several memecoins to show early signs of recovery — including Popcat (SOL) (POPCAT).
POPCAT is currently trading by solid 19% higher on the day, but the more important development lies in its broader technical structure. After months of consistent downside pressure, the price action is now beginning to hint at a potential trend reversal, supported by a well-defined bullish pattern forming on the daily chart.
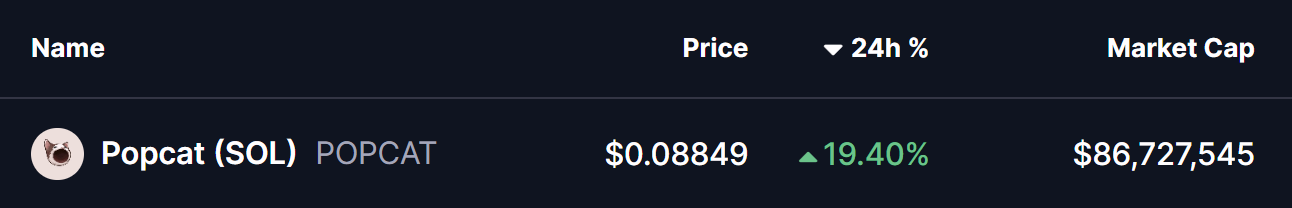
Source: Coinmarketcap
Falling Wedge Pattern in Play
On the daily timeframe, POPCAT appears to be carving out a falling wedge formation — a classic bullish reversal pattern that often develops after extended downtrends. This structure is characterized by lower highs and lower lows that gradually converge, reflecting weakening selling pressure and growing buyer interest near the lows.
Following weeks of steady decline, POPCAT recently established a local bottom near the $0.0725 region. This area acted as a strong demand zone, where buyers stepped in aggressively and prevented further downside. The resulting rebound pushed price back toward the $0.088 level, placing POPCAT just beneath the wedge’s upper resistance trendline.
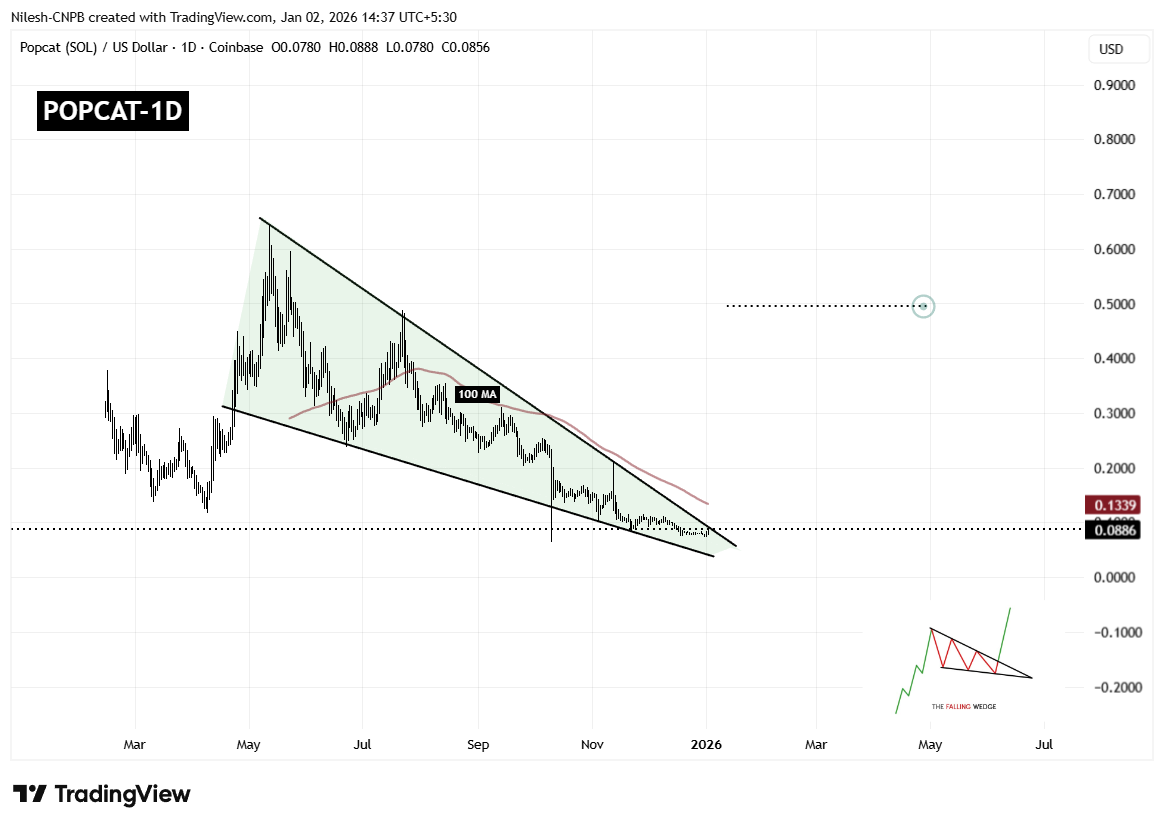
Popcat (POPCAT) Daily Chart/Coinsprobe (Source: Tradingview)
This compression near resistance is technically significant, as falling wedges tend to resolve with a sharp upside move once price breaks out of the structure. The longer price coils within the wedge, the stronger the eventual breakout tends to be.
However, overhead resistance remains notable. The 100-day moving average, currently hovering around $0.1339, represents a major technical barrier. This level has previously acted as dynamic resistance and will likely be a key area to watch if a breakout occurs.
What’s Next for POPCAT?
If buyers manage to push price decisively above the wedge resistance and reclaim the 100-day moving average with a strong daily close, POPCAT could confirm a bullish breakout. Such a move would mark a clear shift in trend structure and could open the door for a larger recovery rally.
Based on the measured move of the falling wedge pattern, the upside projection points toward the $0.49 region. Reaching this level would represent a substantial recovery from current prices and could attract renewed interest from momentum traders and sidelined participants.
That said, failure to break above resistance could result in continued consolidation. In a bearish scenario, POPCAT may revisit the $0.072 support zone once again. As long as this level continues to hold, the broader falling wedge structure would remain intact, keeping the bullish reversal thesis alive.
Overall, POPCAT is approaching a technically critical juncture. With price tightly compressed, selling pressure fading, and buyers defending key support levels, the coming sessions could prove decisive in determining whether this memecoin is ready to stage its next meaningful move higher.
Disclaimer: The views and analysis presented in this article are for informational purposes only and reflect the author’s perspective, not financial advice. Technical patterns and indicators discussed are subject to market volatility and may or may not yield the anticipated results. Investors are advised to exercise caution, conduct independent research, and make decisions aligned with their individual risk tolerance.
About Author: Nilesh Hembade is the Founder and Lead Author of Coinsprobe, with over 5 years of experience in the cryptocurrency and blockchain industry. Since launching Coinsprobe in 2023, he has been providing daily, research-driven insights through in-depth market analysis, on-chain data, and technical research.

Disclaimer: The information on this page may come from third parties and does not represent the views or opinions of Gate. The content displayed on this page is for reference only and does not constitute any financial, investment, or legal advice. Gate does not guarantee the accuracy or completeness of the information and shall not be liable for any losses arising from the use of this information. Virtual asset investments carry high risks and are subject to significant price volatility. You may lose all of your invested principal. Please fully understand the relevant risks and make prudent decisions based on your own financial situation and risk tolerance. For details, please refer to
Disclaimer.
Related Articles
The crypto market is broadly down; only the RWA sector is up slightly, at 0.42%.
On April 7, the crypto market fell broadly, with only the RWA sector up slightly by 0.42%. Major coins Bitcoin and Ethereum declined by 0.34% and 0.43%, respectively. Other sectors generally contracted, but some projects such as Creditcoin and Centrifuge rose against the trend.
GateNews45m ago
Tom Lee has released a post-war asset ranking, with Ethereum outperforming the broader market to win second place.
Tom Lee said on CNBC that since the start of geopolitical conflicts, Ethereum has outperformed the broader market, posting a gain of more than 8% and ranking second globally. Wartime fiscal spending is expected to grow, which will provide support for the market. BitMine recently holds more than 4.8 million Ether—equivalent to more than 4.8 million Ethereum—showing bullish confidence and strategy.
MarketWhisper1h ago
Tom Lee: The crypto winter is about to come to an end, and BitMine is accelerating its purchases of Ethereum
Ethereum reserve firm BitMine has recently accelerated its purchases of ETH. Its ETH holdings have surpassed 4.8 million coins, and its asset size has reached $11.4 billion. The company’s chairman, Tom Lee, believes that the mini-crypto winter is nearing its end, and that ETH’s current price does not yet reflect its high usability and its position as a direction for future financial development.
BitMine accelerates buying ETH
BitMine disclosed its latest crypto holdings yesterday. As of April 6, BitMine holds assets worth $11.4 billion, including:
4,803,334 ETH
198 bitcoins
$92 million in Eightco Holdings stock (ORBS)
Beast worth $200 million
ChainNewsAbmedia1h ago
Gate Daily Report (April 7): SEC submits crypto “safe harbor” proposal to the White House; Argentina president and LIBRA call records exposed
Bitcoin gives back its gains on April 7, trading at $68,800. A U.S. SEC “safe harbor” proposal for crypto has been submitted for review by the White House. Argentina’s President Milei has been accused of having multiple calls with LIBRA’s founder, sparking a scandal. Bitcoin’s market volatility is high; it’s advised to control leverage to prevent large-scale liquidations.
MarketWhisper1h ago
Why is Bitcoin down today? Saudi petrochemical industrial facilities were hit, and Trump issued an ultimatum to Iran
Bitcoin (BTC) fell to about $68,800 on April 7, driven by geopolitical risks in the Middle East and Trump’s hardline remarks toward Iran. The Saudi explosion incident boosted global safe-haven sentiment, and technical indicators showed overbought pressure. In addition, Bitcoin’s key support lies in the $67,500 to $69,500 range; if it breaks below $66,000, the risk will widen to $64,000. Several analysts believe the pullback is more like a healthy correction rather than a trend reversal.
MarketWhisper1h ago
The Crypto Fear and Greed Index fell to 11 today, and the market is still in an extreme state of fear
Gate News, April 7: According to Alternative.me data, the Crypto Fear and Greed Index today dropped to 11, down further from yesterday’s 13. The market remains in an “extreme fear” state.
GateNews2h ago
