Date: Sun, Dec 28, 2025 | 09:40 AM GMT
The broader cryptocurrency market is showing modest strength, with both Bitcoin (BTC) and Ethereum (ETH) trading in the green. This steady performance among major assets has helped stabilize overall sentiment, allowing select memecoins — including SPX6900 (SPX) — to begin showing constructive technical setups.
SPX is trading with a modest intraday gain, but more importantly, its price structure is starting to reflect a classic bullish reversal pattern. After weeks of sustained downside pressure, buyers appear to be stepping back in at key levels, hinting that the worst of the correction may already be behind.
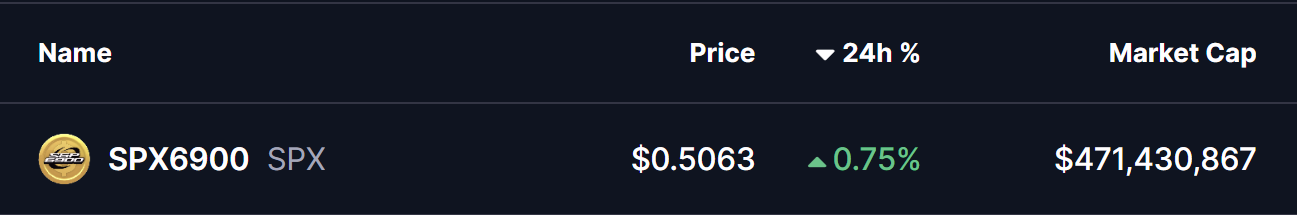
Source: Coinmarketcap
Double Bottom Pattern in Play
On the daily timeframe, SPX is forming a double bottom pattern — a widely followed bullish reversal structure that often appears near the end of prolonged downtrends. The first bottom formed in November when SPX dropped toward the $0.45 region, followed by a recovery that carried price back toward the neckline resistance near $0.7389 in early December.
That recovery attempt, however, was rejected, sending SPX back down to retest the same $0.45 support zone. Importantly, sellers failed to push price meaningfully lower on this second attempt. Instead, SPX printed another strong reaction from the same demand area and has since rebounded to trade around $0.5045.
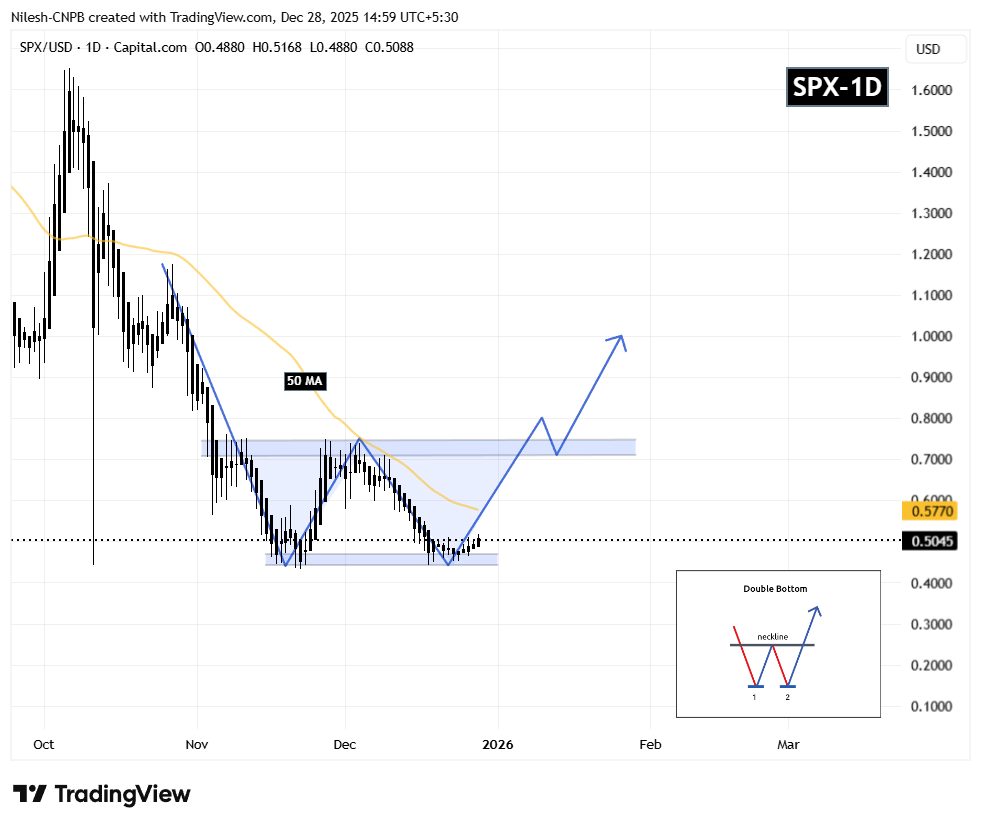
SPX6900 (SPX) Daily Chart/Coinsprobe (Source: Tradingview)
This repeated defense of the same support level is a critical technical signal. It suggests that selling pressure is weakening while buyers are gradually absorbing supply — a behavior typically seen during accumulation phases before trend reversals.
What’s Next for SPX?
For the bullish structure to strengthen, SPX must reclaim the 50-day moving average, currently positioned near $0.5770. A sustained move above this level would mark an important shift in short-term momentum and increase the probability of a continued recovery toward the neckline resistance at $0.7389.
A decisive breakout above the neckline — ideally followed by a successful retest — would confirm the full activation of the double bottom pattern. In that scenario, the technical projection points toward a potential upside target near $1.02, representing a significant expansion from current price levels.
Until then, the $0.45 support zone remains the most important level to watch. As long as SPX continues to hold above this area, the broader bullish setup stays intact and allows room for further upside attempts.
Overall, SPX’s structure appears constructive. The presence of a double bottom, repeated demand at identical lows, and proximity to the 50-day moving average suggest that this could be a pivotal moment as the token attempts to transition from accumulation into a new expansion phase.
Disclaimer: The views and analysis presented in this article are for informational purposes only and reflect the author’s perspective, not financial advice. Technical patterns and indicators discussed are subject to market volatility and may or may not yield the anticipated results. Investors are advised to exercise caution, conduct independent research, and make decisions aligned with their individual risk tolerance.
About Author: Nilesh Hembade is the Founder and Lead Author of Coinsprobe, with over 5 years of experience in the cryptocurrency and blockchain industry. Since launching Coinsprobe in 2023, he has been providing daily, research-driven insights through in-depth market analysis, on-chain data, and technical research.

Disclaimer: The information on this page may come from third parties and does not represent the views or opinions of Gate. The content displayed on this page is for reference only and does not constitute any financial, investment, or legal advice. Gate does not guarantee the accuracy or completeness of the information and shall not be liable for any losses arising from the use of this information. Virtual asset investments carry high risks and are subject to significant price volatility. You may lose all of your invested principal. Please fully understand the relevant risks and make prudent decisions based on your own financial situation and risk tolerance. For details, please refer to
Disclaimer.
Related Articles
Bitcoin fell 23.8% in Q1 2026, marking the worst first-quarter performance since 2018
Bitcoin fell 23.8% in the first quarter of 2026, marking its worst performance since 2018. The decline was mainly driven by outflows from spot ETF fund flows and high inflation. Despite the near-term drop, analysts say long-term conviction in Bitcoin has not changed, and it’s important to watch shifts in the macro environment and incoming capital flows.
GateNews4m ago
The Bitcoin Fear Index has been at a 12-day low, and whales dominate or hint at a potential buying opportunity
The current Crypto Fear and Greed Index shows an “Extreme Fear” state, and investors’ sentiment is cautious. Despite a weak market, on-chain data indicates potential bottoming signs, with whales holding the upper hand and retail investors pulling back. Bitcoin may be facing a buying opportunity as the market gradually builds momentum, setting the stage for future gains.
GateNews11m ago
XRP price has fallen more than 60% from its all-time highs—can ETF inflows and Trump’s support help drive a rebound?
Even though the legal dispute between Ripple and the SEC may end in 2025, the XRP price is still 64% below its all-time high. ETF inflows and policy support provide support, but the market remains cautious about XRP’s outlook. Analysts say the price is constrained by the overall economic environment, and investors need to pay attention to macro factors and Ripple’s development.
GateNews12m ago
Dogecoin News: The Team Announces a Full Restructuring—Can the DOGE Price Bounce Keep Going?
The Dogecoin team announced a reorganization plan, officially rebranding as DogeCoin Financial Solutions LLC™, and released a new whitepaper. Although the DOGE price rebounds in the short term, the community is divided in its reaction to the brand change, and some members doubt its authenticity. Market technical indicators show that downward risk still exists in the short term, and investors need to pay attention to reorganization progress and shifts in market sentiment.
GateNews16m ago
Bitcoin plunges 24% in the first quarter, its worst performance since 2018
In the first quarter of 2026, the price of Bitcoin fell 23.8%, marking its worst performance since 2018. Starting the year, the price dropped from $87,508 to $66,619, for a cumulative loss of 41.6%. Analysts believe that the main reasons include macroeconomic uncertainty and heightened geopolitical tensions in the Middle East. In addition, ETF outflows have further increased pressure. Despite near-term difficulties, long-term confidence remains solid, and institutional participation trends look positive. The market is watching how developments in the Middle East could affect Bitcoin and overall cryptocurrency market sentiment.
GateNews18m ago
If the U.S. Military Were to Invade Iran, How Would Bitcoin Fluctuate? Historical Data Reveals Key Patterns
As geopolitical tensions escalate, investors are watching how Bitcoin may perform in a potential Iran war. Historical data shows that market reactions are often limited at the beginning of wars, but Bitcoin typically behaves like a high-risk asset and is susceptible to macroeconomic factors. In the short term, it may fall or stabilize, so investors need to monitor relevant economic indicators and the course of the conflict.
GateNews35m ago
