Virtuals Protocol (VIRTUAL) – a token associated with the artificial intelligence sector – has surprised many by ignoring pessimistic forecasts about the risk of entering a “bubble” phase, continuing its impressive upward trend.
Previously, VIRTUAL experienced a correction pressure with a 12% decline and entered a downward trend. However, in the past 24 hours alone, this token has reversed strongly, rising to lead the market with an increase of about 21% at the time of recording.
This notable recovery occurred immediately after a community vote, when over 86,000 out of a total of 104,000 participants – approximately 83% – expressed optimistic views. This positive consensus quickly spread and was reflected clearly in both on-chain and off-chain activities, indicating investor confidence is returning to VIRTUAL.
User growth and revenue support the price rally
Investor activity around VIRTUAL remains high. According to Artemis, user engagement and protocol revenue have both increased significantly in the past 24 hours.
Data shows that the number of spot traders transacting VIRTUAL on decentralized exchanges has risen to 3,700, the highest since December 19.
The increasing trading volume indicates greater acceptance and use of VIRTUAL, thereby driving up the price and improving revenue efficiency.
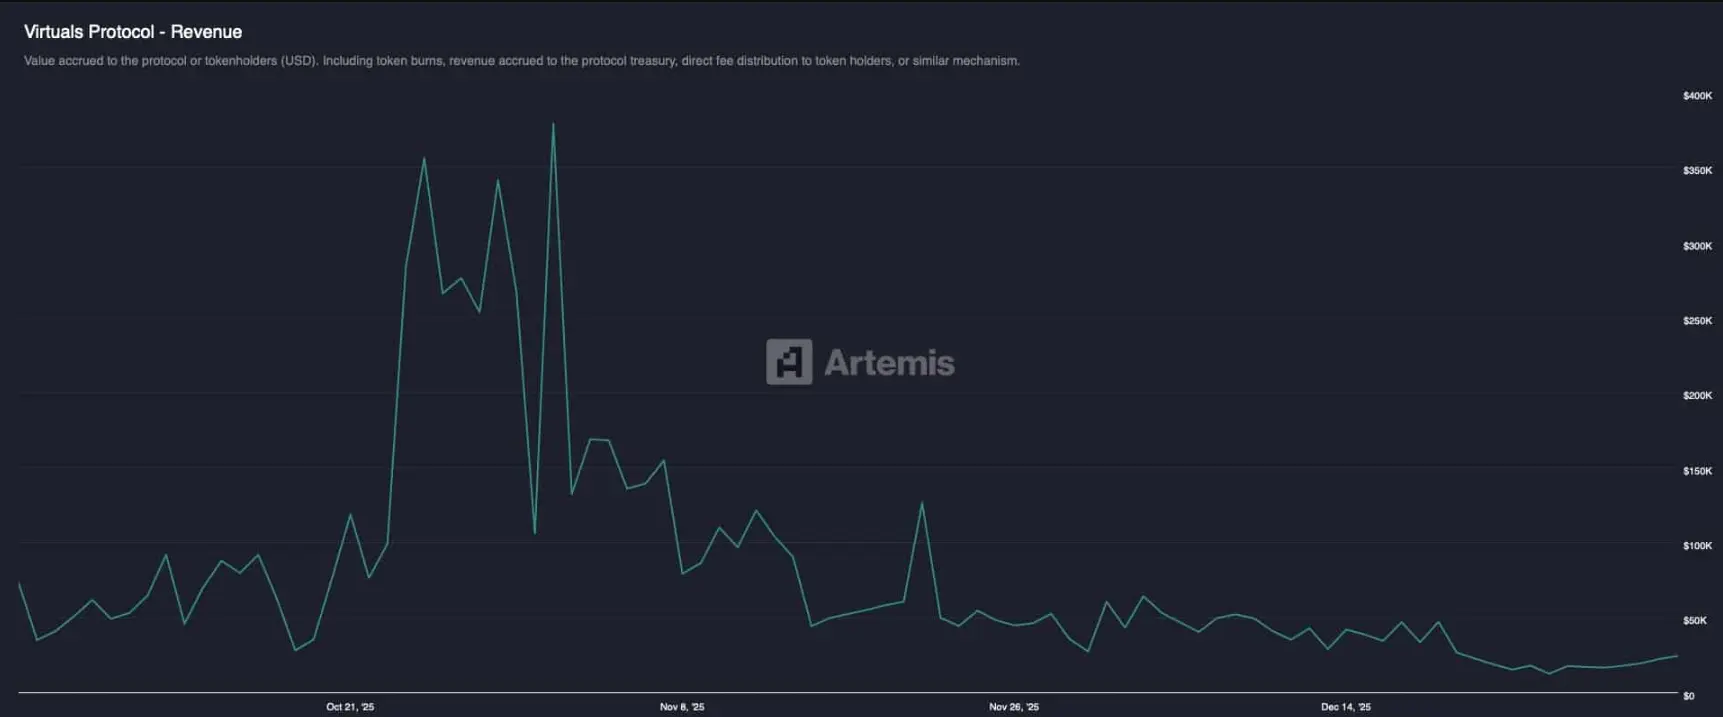 Source: Artemis According to DeFiLlama, protocol revenue in the past 24 hours alone has exceeded $26,000, a level only seen in mid-December, when overall market sentiment was still very pessimistic.
The simultaneous increase in user numbers and revenue suggests a positive outlook is being reinforced, which could support further price increases.
Other driving factors remain in play
The derivatives market is becoming a key driver in VIRTUAL’s recent volatility, as liquidity flows have surged thanks to a wave of investors opening long positions (Long).
Market data shows total liquidity has increased by more than $24.4 million in just 24 hours, mostly from Long contracts, reflecting positive investor expectations.
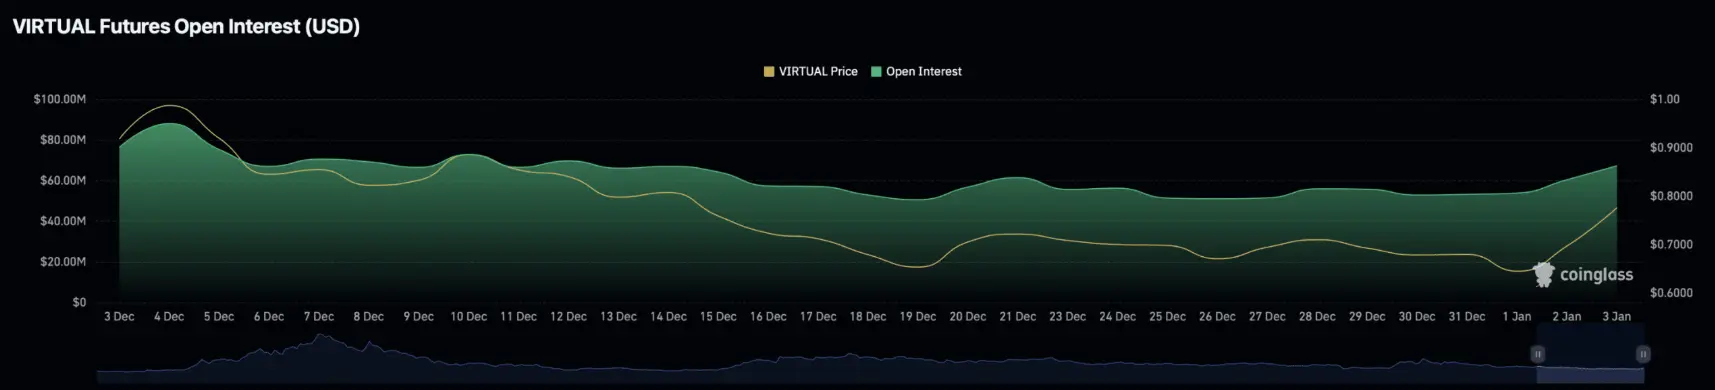 Source: CoinGlass Additionally, data from CoinGlass on Funding Rate based on Open Interest (OI) — a metric measuring the liquidity status of perpetual contracts based on the balance between buyers and sellers — also supports this trend. Typically, a positive funding rate indicates bullish dominance. At the time of writing, this index stands at 0.0055%, suggesting market sentiment is leaning toward a moderate optimistic outlook.
Meanwhile, data on long/short ratios — reflecting the correlation between buy and sell positions — continues to confirm buying pressure dominance, as Long contracts traded overwhelmingly surpass Short positions.
Unfilled liquidity zones remain a major risk
From an analysis perspective of liquidation clusters on the price chart, the risk of correction has not been entirely eliminated.
These liquidation clusters often act as “price magnets,” serving as support zones or forming important resistance levels. On the chart, they are usually highlighted with bright colors such as green or yellow, making it easier for investors to identify sensitive liquidity areas.
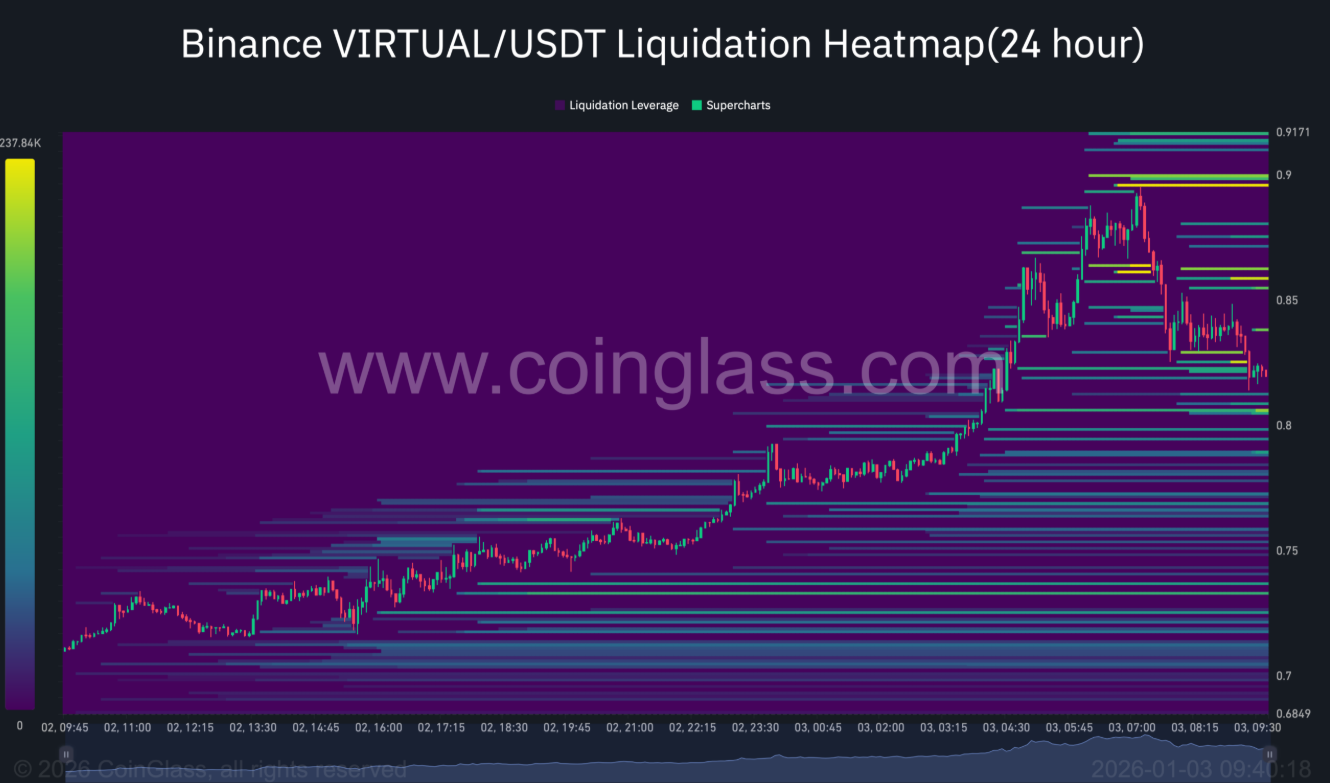 Source: CoinGlass Currently, most liquidity clusters are still concentrated below the current trading price, reflecting downward momentum still prevailing over upward forces.
However, the risk of a sharp decline seems to be contained. The reason is that the liquidation value of short positions (Short) has exceeded that of long positions (Long), creating a relative advantage for long holders. Specifically, at the time of writing, total Short liquidation value is around $491,000, significantly higher than the $134,000 of Long positions.
SN_Nour
Disclaimer: The information on this page may come from third parties and does not represent the views or opinions of Gate. The content displayed on this page is for reference only and does not constitute any financial, investment, or legal advice. Gate does not guarantee the accuracy or completeness of the information and shall not be liable for any losses arising from the use of this information. Virtual asset investments carry high risks and are subject to significant price volatility. You may lose all of your invested principal. Please fully understand the relevant risks and make prudent decisions based on your own financial situation and risk tolerance. For details, please refer to
Disclaimer.
Related Articles
BTC 15-minute drop of 0.67%: leverage exits layered with short-side dominance sparked a short-term pullback
From 2026-04-02 01:00 to 01:15 (UTC), the BTC return rate recorded -0.67%. The K-line data range was 67,639.7 to 68,595.1 USDT, with a range of 1.39%. During this period, market attention increased, volatility noticeably intensified, and investors’ trading behavior became more short-term.
The main drivers of this unusual move were the concentrated withdrawal of leverage capital in the derivatives market and bearish sentiment taking the lead. Futures open interest fell by about $200 million in just 15 minutes, reflecting a faster release of leverage-related risk. At the same time, the funding rate turned negative, indicating that the bears had gained dominance.
GateNews3m ago
Why is Bitcoin rising today? Trump plans to declare the end of the war, and the short covering potential is being strengthened.
U.S. President Trump plans to announce that Iran’s military targets have been achieved, the war is nearing its end, and the U.S. and Iran are in talks to negotiate a ceasefire. This situation is boosting market sentiment and pushing Bitcoin higher. K33 Research shows that Bitcoin ETF shorts have reached a historical high, and the market structure indicates signs that a bottom may be forming, suggesting a possible near-term uptrend.
MarketWhisper17m ago
ETH 15-minute rally up 0.72%: technical rebound signals and derivatives positions in sync drive the market up
From 2026-04-02 00:30 to 2026-04-02 00:45 (UTC), the ETH 15-minute candlestick shows a gain of +0.72%. The price range is 2137.74 to 2157.47 USDT, with a swing of 0.92%. The volatility is moderate, but as market attention to this unusual move increases, the interest in related market conditions and risk discussions also rises.
The main driver of this unusual move is the convergence of multiple technical rebound signals and derivatives positioning at high levels. A long-legged doji on the monthly chart has formed, creating expectations of a trend reversal. On the daily chart, the RSI is already at 42, having dropped into the oversold zone. 4
GateNews33m ago
Today’s Crypto Fear and Greed Index has risen to 12, and the market is in extreme fear.
Gate News message, April 2, according to Alternative.me data, today the Crypto Fear and Greed Index rose to 12 (the index was 8 yesterday), and the market is in an "extreme fear" state.
GateNews38m ago
Here’s the Shiba Inu (SHIB) Price if Burn Rate Collapse Triggers a Supply Shock
Shiba Inu is experiencing dual narratives: it's now recognized as a digital commodity, yet faces pressure from a high exchange influx and a drastic 98% drop in burn rate. While the price remains steady at $0.00000609, future movements depend on increased burn activity and market demand.
CaptainAltcoin2h ago
Markets Down 25%, Sentiment Up 80%: 5 Macro Catalysts—From Trade Easing to Fed Printing that Could Ignite the Next Explosive Surge.
Market sentiment is rising despite a 25% decline, signaling early accumulation behavior.
Macro factors like easing policy and weaker dollar support altcoin recovery potential.
Infrastructure and narrative-driven tokens may lead the next market phase.
The crypto market has plunged into a
CryptoNewsLand4h ago
