The Chainlink (LINK) price hasn’t really gone anywhere since its 2021 peak. It’s been boring for a long time, but that boredom is exactly what tends to form solid foundations.
Top analyst Crypto Patel shared on X that LINK is no longer drifting. The structure on higher timeframes is starting to shift.
Rather than reacting to short-term noise, the focus has moved to where LINK is holding and how it is behaving around key levels.
- What the LINK Chart Is Showing
- Why Accumulation Matters Here For LINK
- What Comes Next for LINK
What the LINK Chart Is Showing
On the 2W chart, the Chainlink price continues to defend a multi-year support zone that has held since the last cycle.
Firstly, it was observed that the price was able to push through the level of resistance and retest it effectively, which is a particularly common occurrence when reversals occur in the initial stages of
LINK has additionally been holding levels above the 0.618 Fibonacci level, which is often seen as the reversal point from bounce to breakdown. As long as the price is trading above that area, the overall picture is positive.
More importantly, the LINK price has been forming higher lows. That change signals a gradual shift in momentum after years of lower highs and range-bound action.
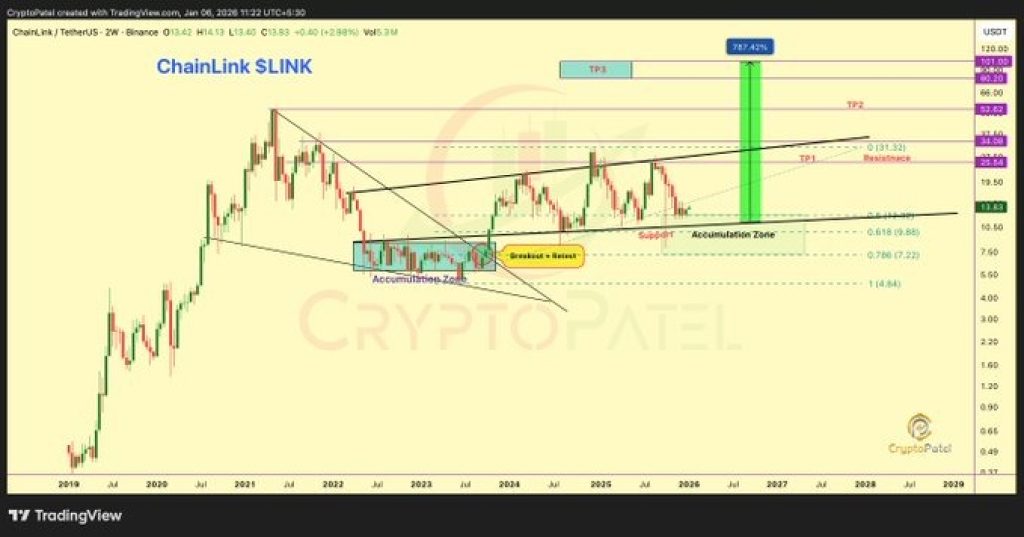
Source: X/CryptoPatel
Why Accumulation Matters Here For LINK
One of the key points in Patel’s analysis is the accumulation range between the low double-digit area. Price has repeatedly returned to that zone and found buyers instead of continuing lower. That behavior suggests longer-term positioning rather than short-term speculation.
This kind of price action usually does not lead to immediate breakouts. It builds pressure. The longer price holds and compresses, the more decisive the eventual move tends to be.
_****XRP Re-Enters the Picture Amid Venezuela’s Sanctions Pressure**
Moreover, the main resistance zone sits well above current levels. If the LINK price manages to break and hold above that range, it would open the door for a much larger expansion move. Until then, price is still in a preparation phase.
Patel’s higher targets depend on one condition above all else. LINK must continue to hold above its key invalidation level. A weekly close below that line would weaken the bullish thesis and shift the focus back to defense.
What Comes Next for LINK
This is not a fast trade. It is a patience-based setup. LINK does not need to surge tomorrow to stay constructive.
It needs to keep doing what it is doing now: holding structure, respecting support, and gradually tightening its range.
After years of consolidation, the Chainlink price is no longer drifting aimlessly. Pressure is building. Whether that pressure resolves higher will depend on how price reacts when it finally meets resistance again.
Disclaimer: The information on this page may come from third parties and does not represent the views or opinions of Gate. The content displayed on this page is for reference only and does not constitute any financial, investment, or legal advice. Gate does not guarantee the accuracy or completeness of the information and shall not be liable for any losses arising from the use of this information. Virtual asset investments carry high risks and are subject to significant price volatility. You may lose all of your invested principal. Please fully understand the relevant risks and make prudent decisions based on your own financial situation and risk tolerance. For details, please refer to
Disclaimer.
Related Articles
Will XRP Hold $1.33 or Extend Toward $1.30 Before Rebound?
XRP is currently trading at $1.35, experiencing a 1.3% decline. Key support is at $1.34, while resistance is at $1.40. The price is testing around the Fibonacci levels of $1.33 and $1.30, crucial for potential upward movement or deeper decline.
CryptoNewsLand4h ago
Dogecoin Monthly Breakdown Pattern Reappears as Price Tests $0.0918
Dogecoin is currently trading at $0.09205 at a gain of 2.3, with support of above $0.08878.
As can be seen in the monthly chart, there are recurring breakdown areas that have been followed by significant expansions in price.
The short-term trading range is narrow and the immediate point o
CryptoNewsLand4h ago
Solana Nears $95 Resistance With $17B Volume Surge
Solana approaches a key resistance level near $95, with increased trading volume and open interest signaling active trader interest. The token is currently at $90.20, facing potential upward movement if it surpasses $95, but may test $85 if rejected.
CryptoFrontNews4h ago
Bitcoin Slips to $68,000 as Middle East Conflict and US Jobs Data Trigger Sell-Off
Bitcoin surrendered its $70,000 support level, triggering a broader crypto market retreat that wiped out $329 million in leveraged positions. This downturn was fueled by a perfect storm of geopolitical and macroeconomic pressures.
Wiping out the ‘War Gains’
Bitcoin’s midweek resilience
Coinpedia4h ago
PEPE Hovers at Critical $0.053414 Support as $432M Volume Surge Tightens Breakout Watch
PEPE is trading at $0.053416, just above support at $0.053414, with significant trading volume up 22.14%. Resistance is at $0.053676. Despite a slight decrease in price, there’s increased market activity, suggesting potential volatility.
CryptoNewsLand5h ago
DXY Retest at 99.183: Will 100–101 Break as US Degen Index Stabilizes?
DXY trades at 99.183 while retesting the 100–101 monthly resistance zone.
US Degen Index 6900 sits at $0.0001197 with support at $0.0001175 and resistance at $0.0001214.
A break above 101 on DXY would shift structure higher, while rejection keeps price below key resistance.
The U.
CryptoNewsLand5h ago