
Date: Fri, Jan 02, 2026 | 09:15 AM GMT
The broader cryptocurrency market has started the new year on a stable footing, with both Bitcoin (BTC) and Ethereum (ETH) trading slightly higher and posting gains of over 1.5%. This modest strength across major assets has provided breathing room for risk-on sentiment, allowing several memecoins to show early signs of recovery — including Popcat (SOL) (POPCAT).
POPCAT is currently trading by solid 19% higher on the day, but the more important development lies in its broader technical structure. After months of consistent downside pressure, the price action is now beginning to hint at a potential trend reversal, supported by a well-defined bullish pattern forming on the daily chart.
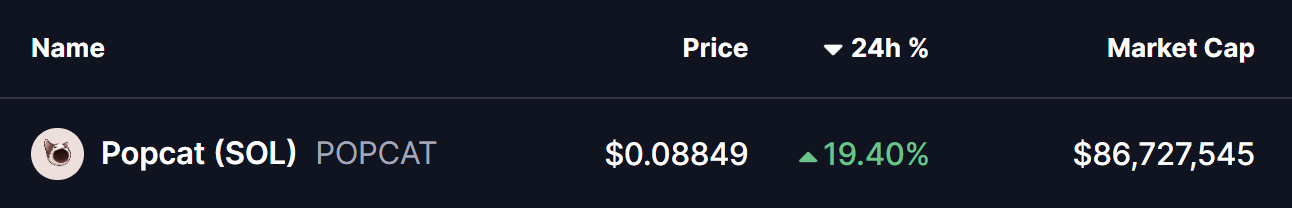
Source: Coinmarketcap
Falling Wedge Pattern in Play
On the daily timeframe, POPCAT appears to be carving out a falling wedge formation — a classic bullish reversal pattern that often develops after extended downtrends. This structure is characterized by lower highs and lower lows that gradually converge, reflecting weakening selling pressure and growing buyer interest near the lows.
Following weeks of steady decline, POPCAT recently established a local bottom near the $0.0725 region. This area acted as a strong demand zone, where buyers stepped in aggressively and prevented further downside. The resulting rebound pushed price back toward the $0.088 level, placing POPCAT just beneath the wedge’s upper resistance trendline.
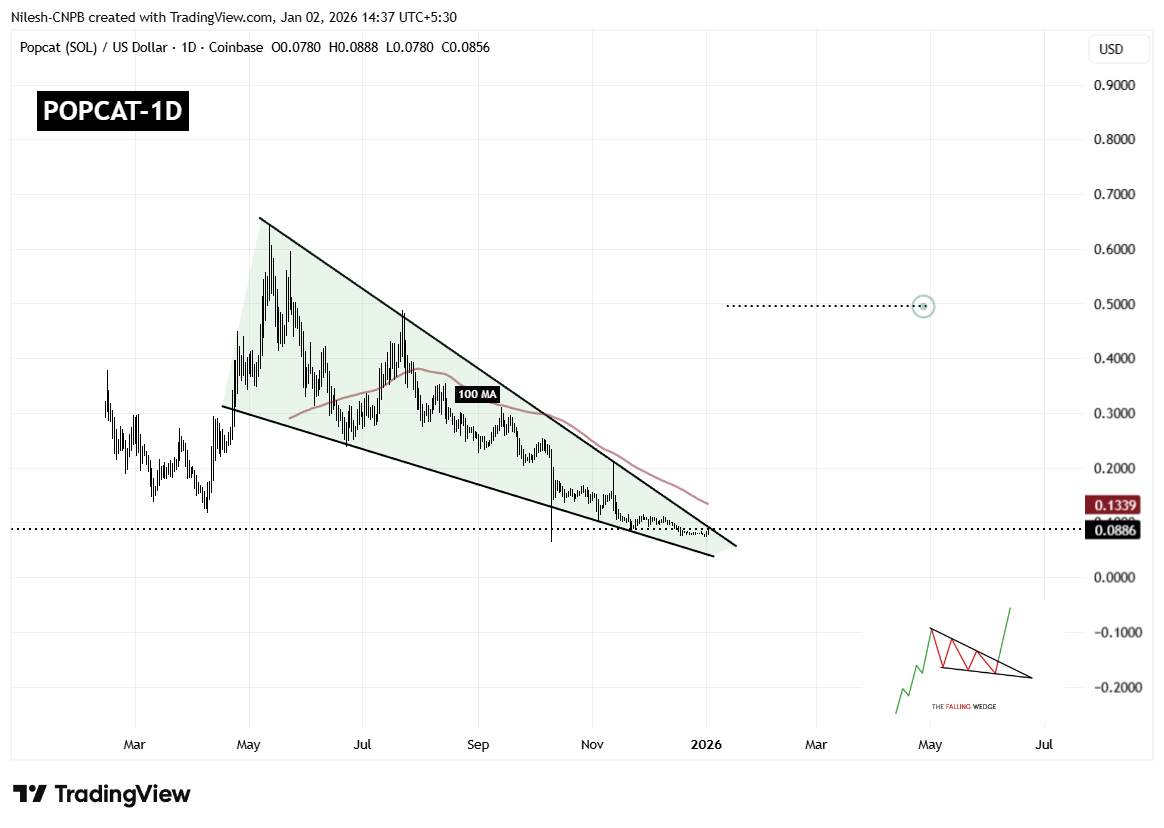
Popcat (POPCAT) Daily Chart/Coinsprobe (Source: Tradingview)
This compression near resistance is technically significant, as falling wedges tend to resolve with a sharp upside move once price breaks out of the structure. The longer price coils within the wedge, the stronger the eventual breakout tends to be.
However, overhead resistance remains notable. The 100-day moving average, currently hovering around $0.1339, represents a major technical barrier. This level has previously acted as dynamic resistance and will likely be a key area to watch if a breakout occurs.
What’s Next for POPCAT?
If buyers manage to push price decisively above the wedge resistance and reclaim the 100-day moving average with a strong daily close, POPCAT could confirm a bullish breakout. Such a move would mark a clear shift in trend structure and could open the door for a larger recovery rally.
Based on the measured move of the falling wedge pattern, the upside projection points toward the $0.49 region. Reaching this level would represent a substantial recovery from current prices and could attract renewed interest from momentum traders and sidelined participants.
That said, failure to break above resistance could result in continued consolidation. In a bearish scenario, POPCAT may revisit the $0.072 support zone once again. As long as this level continues to hold, the broader falling wedge structure would remain intact, keeping the bullish reversal thesis alive.
Overall, POPCAT is approaching a technically critical juncture. With price tightly compressed, selling pressure fading, and buyers defending key support levels, the coming sessions could prove decisive in determining whether this memecoin is ready to stage its next meaningful move higher.
Disclaimer: The views and analysis presented in this article are for informational purposes only and reflect the author’s perspective, not financial advice. Technical patterns and indicators discussed are subject to market volatility and may or may not yield the anticipated results. Investors are advised to exercise caution, conduct independent research, and make decisions aligned with their individual risk tolerance.
About Author: Nilesh Hembade is the Founder and Lead Author of Coinsprobe, with over 5 years of experience in the cryptocurrency and blockchain industry. Since launching Coinsprobe in 2023, he has been providing daily, research-driven insights through in-depth market analysis, on-chain data, and technical research.
Disclaimer: The information on this page may come from third parties and does not represent the views or opinions of Gate. The content displayed on this page is for reference only and does not constitute any financial, investment, or legal advice. Gate does not guarantee the accuracy or completeness of the information and shall not be liable for any losses arising from the use of this information. Virtual asset investments carry high risks and are subject to significant price volatility. You may lose all of your invested principal. Please fully understand the relevant risks and make prudent decisions based on your own financial situation and risk tolerance. For details, please refer to
Disclaimer.
Related Articles
比特幣 ETF 終結連七紅,比特幣價格壓力再現
近期美國比特幣現貨ETF經歷連續七個交易日的淨流入後,出現大幅流出,18日淨流出1.635億美元,19日再流出5190萬美元,顯示市場資金與價格同時減弱。比特幣價格一度跌破7萬美元,這突顯出ETF的資金流向已無法支撐其反彈,且背後宏觀環境變差對風險資產形成壓力,使投資者偏好明顯收縮。7萬美元關卡的測試成為短期市場情緒的風向標。
区块客1m ago
美伊停火訊號矛盾!分析師:伊朗下一步決定比特幣走向
美國推動與伊朗達成停火協議,但伊朗媒體否認有談判。此矛盾消息引發市場波動,股市短暫上漲、油價回落、比特幣反彈。分析師指出,伊朗拒絕和平談判能維持影響力,市場預期緩和或延續緊張將直接影響比特幣價格,且未來局勢走向仍需觀察後續外交動態。
MarketWhisper9m ago
XRP价格压缩区间逼近临界点,1.42美元成多空分水岭
XRP价格在1.41美元附近震荡,短期进入收敛区间。巨鲸增持显示资金布局,但宏观环境限制市场情绪。技术上,若突破1.42美元,将指向1.45至1.50美元;如跌破1.38美元,则可能回调至1.30美元。市场正关注关键价位,以判断后续趋势。
GateNews15m ago
XRP holds near $1.41 as range tightens, breakout setup builds
XRP is currently trading near $1.41, caught in a tight range with support at $1.38 and resistance at $1.42. Accumulation by whales suggests potential for a breakout, but market sentiment remains cautious due to macroeconomic factors.
CoinDesk25m ago
The RWA Yield Infrastructure Trade
The essay highlights challenges in direct RWA token exposure, emphasizes the potential in leverage opportunities amid settlement delays, critiques Morpho's governance token structure, and presents Fluid as a more effective token model with stablecoin links.
CoinDesk1h ago
Finam Analyst: Gold may plummet to $3,100, avoid catching the falling knife, wait for a reversal before rebuilding positions
Russian Finam analyst Dudchenko warned that gold could fall to $3,100 per ounce, advising investors to stay away from the market and wait for price reversal before entering. The gold decline is mainly driven by concerns about the Federal Reserve's interest rate policy and passive liquidations by large institutions. Despite the gold pullback, it is still expected to advance toward $5,000 in the future. The silver market is also facing similar pressure.
MarketWhisper1h ago
