
Date: Thu, Jan 01, 2026 | 10:30 AM GMT
As the new year 2026 begins, the broader cryptocurrency market is showing modest weakness, with both Bitcoin (BTC) and Ethereum (ETH) trading slightly in the red. This soft start has weighed on sentiment across the altcoin space as well, including Monad (MON). However, beneath the surface, MON’s chart structure is beginning to tell a more constructive story.
MON is currently down around 4% on the day, extending its 60-day decline to roughly 21%. While short-term price action remains subdued, the more important signal is emerging on the daily chart, where price structure is beginning to hint at a meaningful shift. If confirmed, this setup could mark the early stages of a bullish continuation following a prolonged corrective phase.
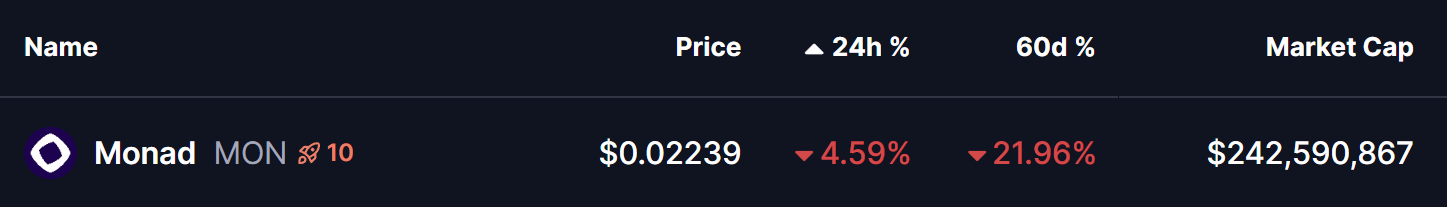
Source: Coinmarketcap
Rounding Bottom in Play
On the daily timeframe, MON appears to be forming a textbook rounding bottom pattern — a classic bullish reversal structure that typically develops after extended downside pressure. This pattern reflects a gradual transition from distribution to accumulation, where selling momentum weakens and buyers begin to step in more consistently.
Previously, MON faced strong rejection near the $0.04923 neckline zone, triggering a sharp decline that unfolded through late November and December. That move eventually found a floor near the $0.017 level, which has since acted as a key demand zone. Repeated defenses of this area prevented any deeper breakdown and helped establish a stable base for a potential trend reversal.
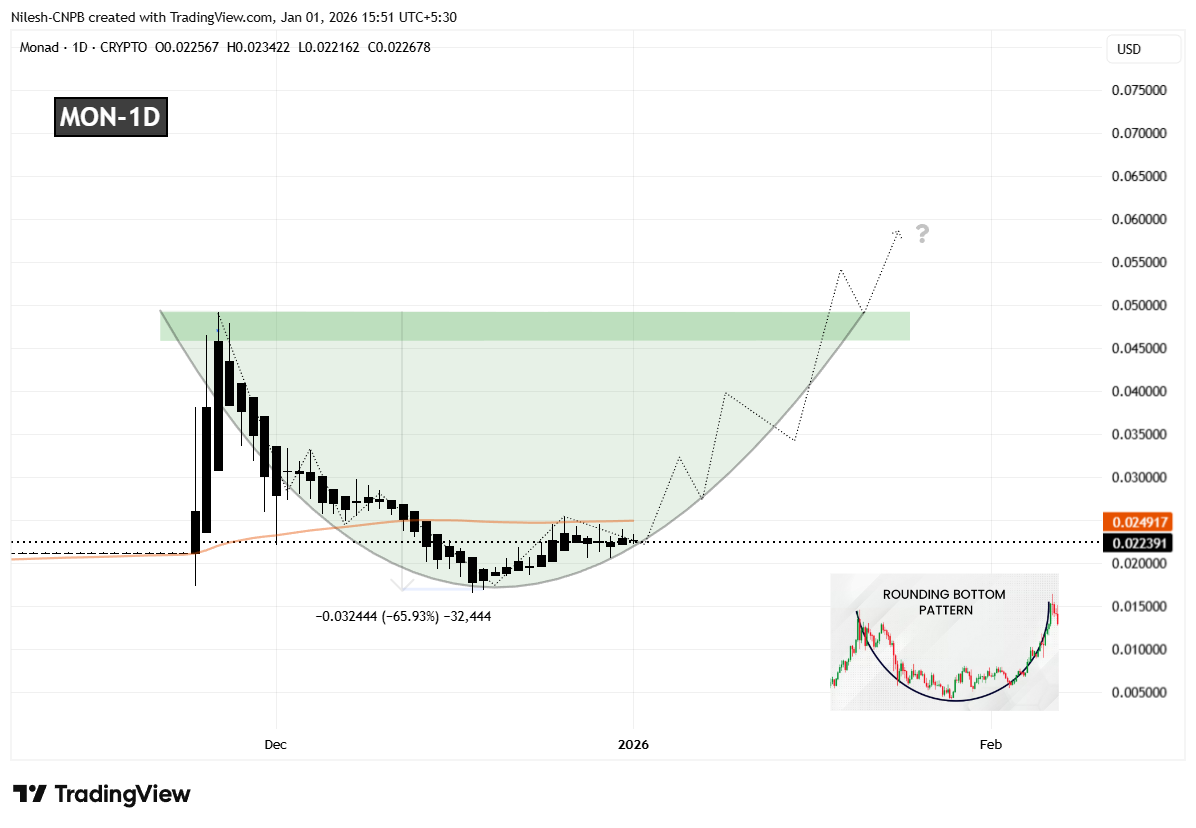
Monad (MON) Daily Chart/Coinsprobe (Source: Tradingview)
Since forming that bottom, MON has started to curve higher in a rounded fashion, closely matching the classic structure of a developing bottoming pattern. This gradual recovery suggests that selling pressure is fading rather than accelerating. The recent stabilization and recovery back above the $0.022 region further indicate that accumulation may be taking place as the market quietly prepares for a larger move.
What’s Next for MON?
For the rounding bottom pattern to move into confirmation, MON needs to reclaim the 50-day moving average, currently positioned near the $0.02491 level. A sustained move above this area would signal a shift in short-term momentum and confirm that buyers are beginning to regain control after months of corrective price action.
Looking ahead, the most significant technical hurdle remains the neckline resistance around $0.04923. A clean and decisive breakout above this zone would validate the entire reversal structure and could open the door for a broader bullish expansion phase, with momentum traders likely returning to the market.
Until those levels are reclaimed, the pattern remains in its early development stage. Short-term pullbacks or consolidation remain possible if MON struggles near the 50-day moving average. However, as long as price continues to hold higher lows above the $0.017 base, the broader bottoming structure remains intact.
Overall, MON’s emerging rounding bottom formation suggests the token may be approaching an important inflection point. While confirmation is still pending, the improving structure and alignment with a classic bullish pattern indicate that the coming sessions could be decisive for Monad’s next directional move.
Disclaimer: The views and analysis presented in this article are for informational purposes only and reflect the author’s perspective, not financial advice. Technical patterns and indicators discussed are subject to market volatility and may or may not yield the anticipated results. Investors are advised to exercise caution, conduct independent research, and make decisions aligned with their individual risk tolerance.
About Author: Nilesh Hembade is the Founder and Lead Author of Coinsprobe, with over 5 years of experience in the cryptocurrency and blockchain industry. Since launching Coinsprobe in 2023, he has been providing daily, research-driven insights through in-depth market analysis, on-chain data, and technical research.
Disclaimer: The information on this page may come from third parties and does not represent the views or opinions of Gate. The content displayed on this page is for reference only and does not constitute any financial, investment, or legal advice. Gate does not guarantee the accuracy or completeness of the information and shall not be liable for any losses arising from the use of this information. Virtual asset investments carry high risks and are subject to significant price volatility. You may lose all of your invested principal. Please fully understand the relevant risks and make prudent decisions based on your own financial situation and risk tolerance. For details, please refer to
Disclaimer.
Related Articles
Bitmine Upgrades to the NYSE Main Board! Tom Lee: US stocks may have bottomed out, and selling pressure on Ether could ease
Bitmine has officially moved from the New York Stock Exchange U.S. board to the main board, marking a major milestone for the company. Despite a sharp drop in the stock price, it has still increased the share repurchase plan to $4.0 billion. The company holds a large amount of Ethereum, and expects that a rebound in the crypto market will help strengthen its assets and stock price performance.
CryptoCity1h ago
RAVE’s hype surge triggers a flood of copycat coin mania, as FF and INX expose the “pump-and-dump” scheme
Recently, altcoins represented by RAVE have sparked a fierce investment craze, but some old star projects like FF and INX have used this wave of hype to carry out “pump-and-dump” operations—rapidly driving up coin prices to lure retail investors to buy, and then dumping them heavily, causing the price to plunge rapidly. Such behavior not only exposes the project team’s funding difficulties, but also damages investors’ trust. Investors need to stay alert to signals like abnormal short-term surges in order to avoid the risk of being manipulated by the market.
MarketWhisper1h ago
Bitmine gets promoted to the NYSE main board! Tom Lee: US stocks may have bottomed out, and sell pressure on Ether could ease
Bitmine has officially moved from the NYSE American board to the main board, marking an important milestone for the company. Despite the sharp decline in its share price, it has still increased the share repurchase plan amount to $4 billion. The company holds a large amount of Ethereum, and it expects that a rebound in the crypto market will help boost its assets and share price performance.
CryptoCity5h ago
Why Is Bitcoin Up Today? Hormuz Blockade Triggers Short Squeeze and a BTC Test of $75k
On April 13, Bitcoin rose from its early-session low of 70,741 to trade as high as $74,900 during the session, approaching the $75,000 level. The main drivers came from two directions: after Trump ordered the blockade of the Strait of Hormuz, traders began to view Bitcoin as a geopolitical hedge asset; and a massive net short position that had been building as funding rates stayed persistently negative was met with liquidation, triggering a chain of liquidations totaling millions of dollars near the $70,000 support level.
MarketWhisper6h ago
Bitmine gets promoted to the NYSE main board! Tom Lee: U.S. stocks may have bottomed out, and Ether’s selling pressure may ease
Bitmine has officially moved from the NYSE American board to the main board in the United States, marking an important milestone for the company. Despite a sharp drop in its stock price, it has still increased its share repurchase authorization to $4.0 billion. The company holds a large amount of Ether, and it predicts that a rebound in the crypto market will help boost its assets and stock price performance.
CryptoCity8h ago
U.S. stocks have recovered the losses since the Iran war, while Bitcoin pushes up to 74K
Due to market expectations that the United States and Iran will reach an agreement, the S&P 500 index has rebounded to its highest level since the war, and Bitcoin has also surged to $74,900. Despite the failure of peace talks between the U.S. and Iran, the U.S. has imposed a maritime blockade to pressure Iran. MicroStrategy once again made a large-scale purchase of Bitcoin, indicating that investor confidence is picking up.
ChainNewsAbmedia8h ago
