
Date: Fri, Jan 02, 2026 | 10:54 AM GMT
The broader cryptocurrency market has started the new year with modest strength, as both Bitcoin (BTC) and Ethereum (ETH) trade slightly higher with gains of over 2%. This renewed stability across majors has helped improve overall sentiment, allowing several altcoins to regain momentum — including Aster (ASTER).
ASTER is currently trading around 4% higher on the day, but the more important development lies beneath the surface. On lower timeframes, price action is beginning to highlight a constructive bullish structure, suggesting that the token may be preparing for a meaningful breakout if the setup confirms.
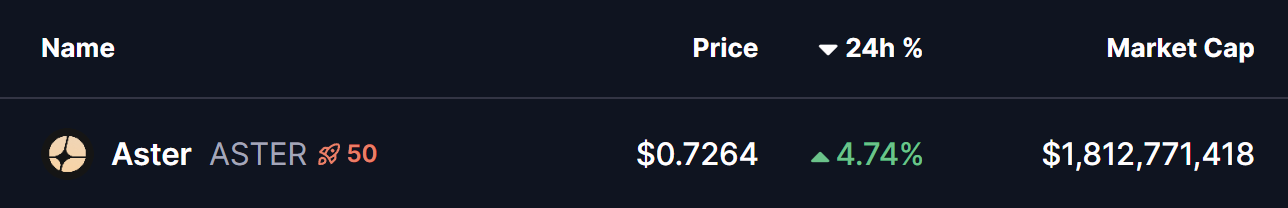
Source: Coinmarketcap
Ascending Triangle Structure Takes Shape
On the 4-hour chart, ASTER is forming a clear ascending triangle, defined by a series of higher lows pressing steadily against a horizontal resistance zone. This type of structure is widely regarded as a bullish continuation pattern, particularly when it develops during consolidation and shows consistent buyer accumulation at rising support levels.
ASTER recently faced rejection near the $0.7367 neckline resistance, which pushed price back toward its ascending support trendline around the $0.68 region. Importantly, each dip has been met with strong buying interest, preventing any deeper pullback and keeping the bullish structure intact. This behavior indicates that sellers are gradually losing control as buyers step in earlier on every retracement.
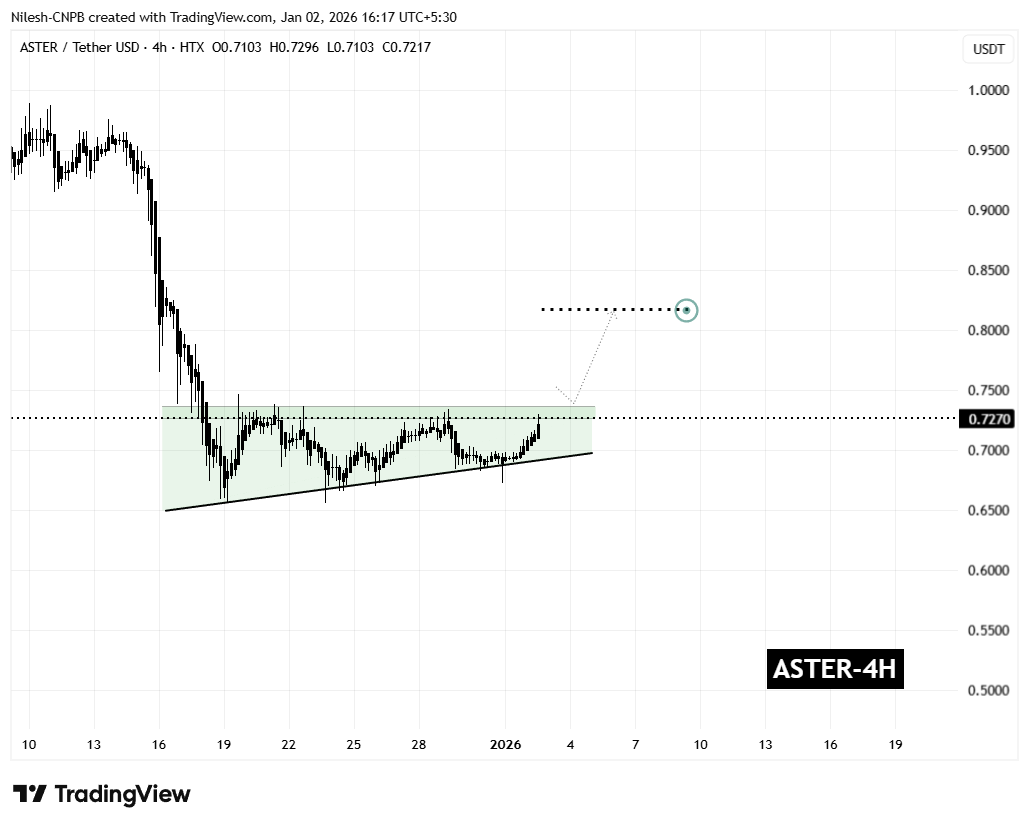
Aster (ASTER) 4H Chart/Coinsprobe (Source: Tradingview)
The latest rebound has once again carried ASTER toward the upper boundary of the triangle, reinforcing the idea that demand remains firm. Rather than signaling weakness, this sideways-to-higher price action reflects healthy consolidation as volatility tightens ahead of a potential breakout.
What’s Next for ASTER?
From here, ASTER appears to be preparing for another test of the $0.7367 resistance zone. A decisive breakout above this level, followed by a sustained close and a successful retest as support, would confirm the ascending triangle pattern and likely trigger a bullish expansion phase.
Based on the measured move of the formation, the technical upside projection points toward the $0.8178 region. This target represents a potential upside of roughly 12% from current levels and also aligns with previous price structure, adding further confidence to the bullish outlook.
That said, caution remains warranted. If ASTER fails to break above resistance, price could once again drift back toward the rising support trendline. As long as this trendline continues to hold, the broader bullish setup remains valid. A decisive breakdown below support, however, would invalidate the pattern and postpone any breakout scenario.
For now, the combination of improving market sentiment, consistent dip-buying, and a tightening ascending triangle structure suggests that Aster is approaching a critical decision point — one that could define its next significant move as 2026 begins.
Disclaimer: The views and analysis presented in this article are for informational purposes only and reflect the author’s perspective, not financial advice. Technical patterns and indicators discussed are subject to market volatility and may or may not yield the anticipated results. Investors are advised to exercise caution, conduct independent research, and make decisions aligned with their individual risk tolerance.
About Author: Nilesh Hembade is the Founder and Lead Author of Coinsprobe, with over 5 years of experience in the cryptocurrency and blockchain industry. Since launching Coinsprobe in 2023, he has been providing daily, research-driven insights through in-depth market analysis, on-chain data, and technical research.
Disclaimer: The information on this page may come from third parties and does not represent the views or opinions of Gate. The content displayed on this page is for reference only and does not constitute any financial, investment, or legal advice. Gate does not guarantee the accuracy or completeness of the information and shall not be liable for any losses arising from the use of this information. Virtual asset investments carry high risks and are subject to significant price volatility. You may lose all of your invested principal. Please fully understand the relevant risks and make prudent decisions based on your own financial situation and risk tolerance. For details, please refer to
Disclaimer.
Related Articles
Cryptocurrency Fear and Greed Index Falls to 8 Today, Market Extreme Panic Sentiment Deepens
Gate News reported that on March 23rd, according to Alternative.me data, today's cryptocurrency fear and greed index fell to 8, declining further from yesterday's 10. The index indicates the market is currently in a state of extreme panic, with panic sentiment continuing to deepen.
GateNews9m ago
The Hormuz Strait crisis remains unresolved, and Bitcoin has fallen below 68K.
Affected by the US-Iran conflict, global markets have been severely impacted, with the S&P 500 Index declining for four consecutive weeks. Gold has experienced a modest rebound around $4,500, while oil prices remain stable at elevated levels. Trump has issued an ultimatum to Iran, with potential escalation of conflict between the two sides. Bitcoin and Ethereum have also declined in tandem, and market sentiment has turned conservative.
ChainNewsAbmedia21m ago
River (RIVER) Price Keeps Pumping as TD Indicator Signals Another Rally
Analyst Ali Martinez highlights the accuracy of the TD Sequential indicator in predicting River (RIVER) price movements. The indicator has consistently identified significant buy and sell signals throughout RIVER's volatility, suggesting potential future trends based on current signals.
CaptainAltcoin1h ago
ETH 15-minute decline of 0.88%: Capital outflow dominates market, intensifying short-term selling pressure
On March 22, 2026, from 21:00 to 21:15 (UTC), Ethereum (ETH) recorded a -0.88% return rate within 15 minutes, with the price fluctuating in the range of 2029.54 to 2060.75 USDT, reaching an amplitude of 1.52%. Market attention has increased, short-term volatility has significantly intensified, reflecting rapid conversion of funding pressure into price pressure.
The main driver of this anomaly is accelerated capital outflows from trading platforms: approximately 420,690 USD equivalent of ETH flowed in within 10 minutes, but the number of withdrawals reached 2,319 transactions in the past 1 hour, far exceeding deposits during the same period by 5
GateNews3h ago
BTC Drops 0.58% in 15 Minutes: Tight Liquidity and Institutional Hedging Create Downward Pressure
2026-03-22 21:00 to 21:15 (UTC), BTC recorded a -0.58% return within just 15 minutes, with prices fluctuating in the range of 67562.1 to 68223.5 USDT, with an amplitude of 0.97%. During this period, market sentiment was highly tense, overall attention increased, and short-term volatility accelerated noticeably.
The main driving force behind this anomaly was the resonance formed by spot market liquidity shortage and medium-sized funds accelerating their exit. On-chain data shows a significant net outflow of -371.99 BTC in the $100k-$1M transaction range, driving selling
GateNews3h ago
Risk-Off Drips throughout Markets
Geopolitical tensions and rising uncertainty have led to a risk-off sentiment in global markets, with investors moving away from assets like Bitcoin and Ethereum. High oil prices and inflation concerns influenced portfolio adjustments, while Bitcoin selling pressure increased as short-term holders took profits. The market remains sensitive amid low sentiment.
CryptoBreaking3h ago
