
**Date: **Sat, Jan 03, 2026 | 06:10 AM GMT
As the 2026 kicks off, the broader cryptocurrency market is showing renewed stability. Bitcoin (BTC) and Ethereum (ETH) are both trading slightly in the green, with ETH posting gains of over 3% today. This steady performance among major assets has helped improve overall market sentiment, allowing select altcoins — including Bitcoin Cash (BCH) — to form constructive technical setups.
Bitcoin Cash is already responding positively, jumping nearly 5% on the day. However, beyond the short-term price move, the daily chart reveals a much more important development. BCH appears to be completing a classic reversal structure, hinting that the recent strength may be the early stage of a larger trend shift rather than just a temporary bounce.
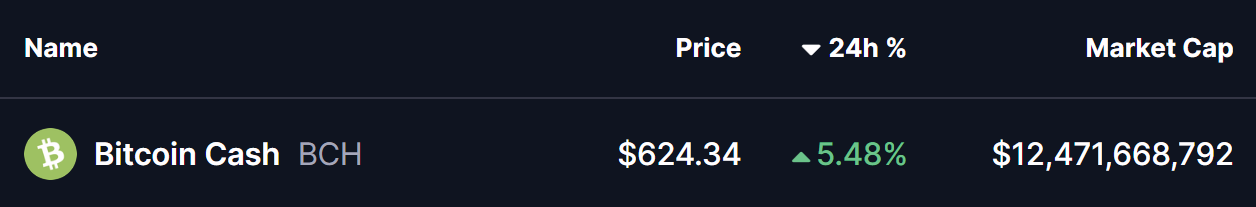
Source: Coinmarketcap
Rounding Bottom in Play?
On the daily timeframe, Bitcoin Cash is forming a rounding bottom pattern, a well-known bullish reversal formation that signals a gradual transition from selling pressure to sustained accumulation. Unlike sharp V-shaped reversals, rounding bottoms reflect patience from buyers and fading control from sellers over an extended period.
This structure began taking shape after BCH faced a strong rejection near the $630 level in September 2025. That rejection triggered a sharp sell-off, pushing price down to the $446.9 region. Crucially, bears failed to force a deeper breakdown. Instead, strong demand emerged, price stabilized, and volatility gradually compressed — laying the foundation for the rounded base visible on the chart.
As weeks passed, BCH began to print higher lows, slowly curving upward and completing the bottoming structure. The recovery has now brought price back toward the $600–$630 resistance zone, which marks the neckline of the rounding bottom and represents a key decision area for the trend.
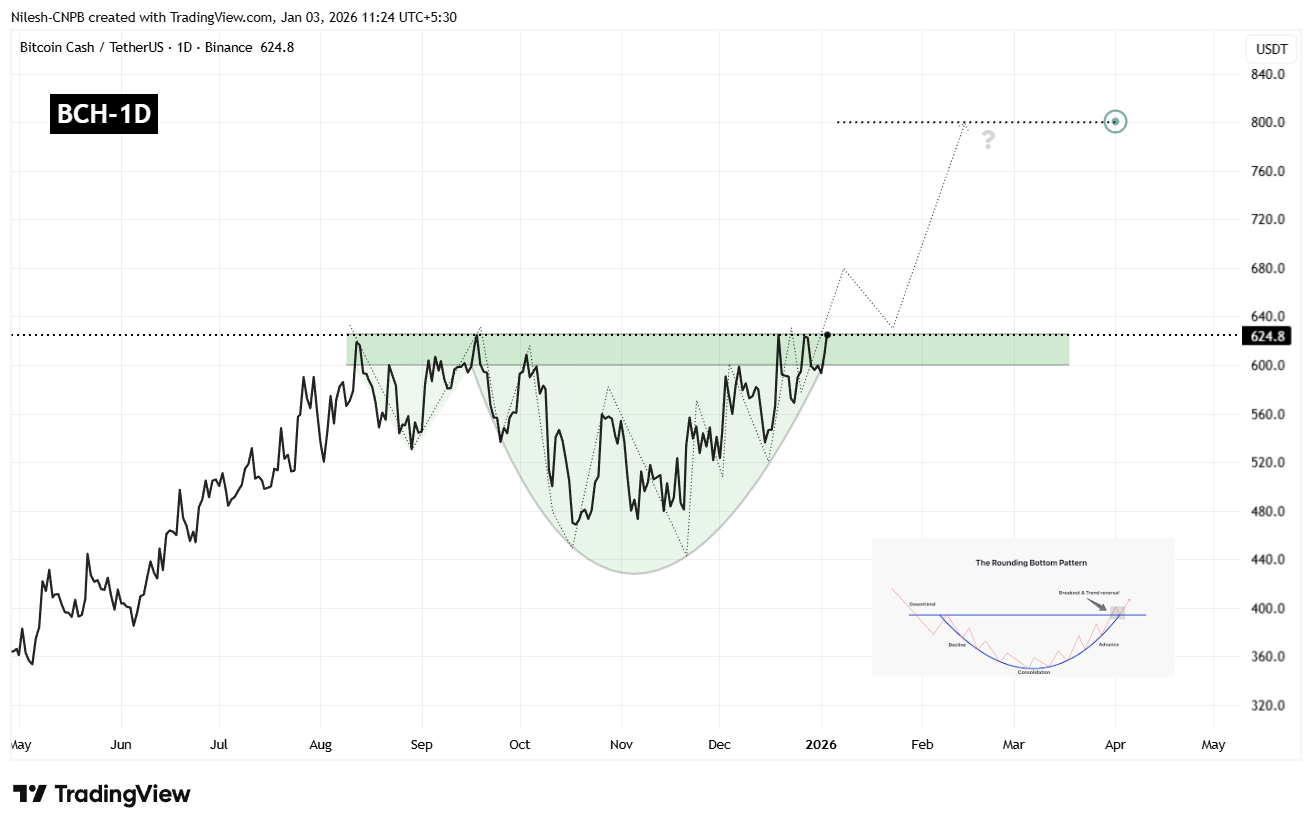
Bitcoin Cash (BCH) Daily Chart/Coinsprobe (Source: Tradingview)
Key Resistance in Focus
At present, BCH is trading near $624, repeatedly testing the $600–$630 zone. This area has historically acted as a supply zone, rejecting price advances multiple times in the past. A decisive daily close above this range would confirm a bullish breakout and signal a shift in market structure.
If bulls manage to push through this resistance and flip it into support, it would strongly validate the rounding bottom pattern and open the door for a continuation rally.
What’s Next for BCH?
A confirmed breakout above $630, followed by a successful retest of the zone as support, would significantly strengthen the bullish outlook. Based on the depth of the rounding bottom formation, the measured upside target points toward the $800–$820 region.
Reaching that level would represent a potential upside of approximately 27% from current prices, aligning well with historical behavior following similar rounding bottom breakouts.
That said, patience remains essential. Before a clean breakout occurs, BCH could still see short-term pullbacks — potentially toward the rising base of the rounded structure or near-term moving averages, which have acted as dynamic support during the recovery. Such retracements would not invalidate the bullish setup as long as price continues to hold above higher low levels.
For now, the $600–$630 zone remains the line in the sand. How BCH behaves around this resistance in the coming sessions will likely determine whether it enters a sustained bullish phase or remains range-bound a bit longer.
Disclaimer: The views and analysis presented in this article are for informational purposes only and reflect the author’s perspective, not financial advice. Technical patterns and indicators discussed are subject to market volatility and may or may not yield the anticipated results. Investors are advised to exercise caution, conduct independent research, and make decisions aligned with their individual risk tolerance.
About Author: Nilesh Hembade is the Founder and Lead Author of Coinsprobe, with over 5 years of experience in the cryptocurrency and blockchain industry. Since launching Coinsprobe in 2023, he has been providing daily, research-driven insights through in-depth market analysis, on-chain data, and technical research.
Disclaimer: The information on this page may come from third parties and does not represent the views or opinions of Gate. The content displayed on this page is for reference only and does not constitute any financial, investment, or legal advice. Gate does not guarantee the accuracy or completeness of the information and shall not be liable for any losses arising from the use of this information. Virtual asset investments carry high risks and are subject to significant price volatility. You may lose all of your invested principal. Please fully understand the relevant risks and make prudent decisions based on your own financial situation and risk tolerance. For details, please refer to
Disclaimer.
Related Articles
PEPE Whales Move $20.7M—Is a Breakout or Breakdown Next?
PEPE whales withdrew $20.7M PEPE, reducing supply and easing sell pressure.
Price holds support, with compression building below key resistance level.
Rising OI and positive funding signal growing bullish momentum and breakout potential.
PepeCoin — PEPE, recently flashed a signal that
CryptoNewsLand11m ago
Bitcoin ETF ends seven consecutive days of gains, Bitcoin price pressure reappears.
Recently, after a continuous net inflow into the U.S. Bitcoin spot ETF for seven trading days, a significant outflow occurred, with a net outflow of $163.5 million on the 18th and another outflow of $51.9 million on the 19th, indicating a simultaneous weakening of market funds and prices. Bitcoin's price briefly fell below $70,000, highlighting that the fund flows from the ETF can no longer support its rebound, and the deteriorating macro environment is putting pressure on risk assets, leading to a noticeable contraction in investor preferences. The testing of the $70,000 level has become a barometer for short-term market sentiment.
区块客11m ago
The RWA Yield Infrastructure Trade
The essay highlights challenges in direct RWA token exposure, emphasizes the potential in leverage opportunities amid settlement delays, critiques Morpho's governance token structure, and presents Fluid as a more effective token model with stablecoin links.
CoinDesk27m ago
Gold plummets, "safe haven for funds" changes hands? JPMorgan: During wartime, "Bitcoin becomes the new darling of hedging."
JPMorgan Chase指出,在中东冲突中,比特币展现出强大的抗跌韧性,资金大规模涌入,交易活动活跃,而黄金和白银则面临资金外流。在高利率和强势美元的压力下,黄金价格下跌约15%。比特币凭借无国界特性成为避险选择,机构投资者也调整了布局,显示黄金流动性下降,而比特币流动性上升。
区块客36m ago
The cryptocurrency fear index has dropped to 9, with the market continuing to maintain "extreme fear."
The current cryptocurrency market fear and greed index has dropped to 9, indicating extreme fear in the market, well below yesterday's 12 and last month's average of 13. This index consolidates multiple indicators to assess market sentiment.
BlockBeatNews41m ago
Ethereum Loses Key Support As Failed Breakout Signals Near-Term Caution for ETH Traders
Ethereum (ETH) continues to trade in a highly volatile environment along with the rest of the crypto market. Recently ETH had an attempt to begin regaining bullish momentum after briefly returning to a major support area; however, it subsequently fell through that level again. Traders and analysts a
BlockChainReporter41m ago
