Key Insights
- SUI is currently battling a 4% daily drop as selling pressure increases near the important $1.80 level.
- Trading volume has fallen by over 32% since yesterday. This indicates a strong decline in market participation and trader activity.
- Technical indicators like the MACD and CMF are currently showing that capital is flowing out of the asset as it tests a neutral RSI zone.
The crypto market has entered a period of cooling after a volatile start to the new year. While several major assets struggle to hold their ground, SUI in particular is facing a difficult test of its recent recovery.
After a brief climb toward the $2.00 mark, the token has started to drift lower as buyers lose their grip.
Most digital assets are trading in the red today, and the general market sentiment remains stuck in a neutral zone.
Technical Signals Weigh on the SUI Price
Market data from TradingView shows that the short-term outlook for SUI has turned quite heavy.
The 4-hour chart shows several red candles in a row, which is a classic sign of bearish control.
Many traders are now watching the $1.70 range as a support level. If the price fails to hold there, it could trigger a “death cross.”
For context, this happens when short-term moving averages fall below long-term ones and often leads to more selling.
The daily chart shows a descending channel as SUI trades between its 100 and 50-day EMAs.
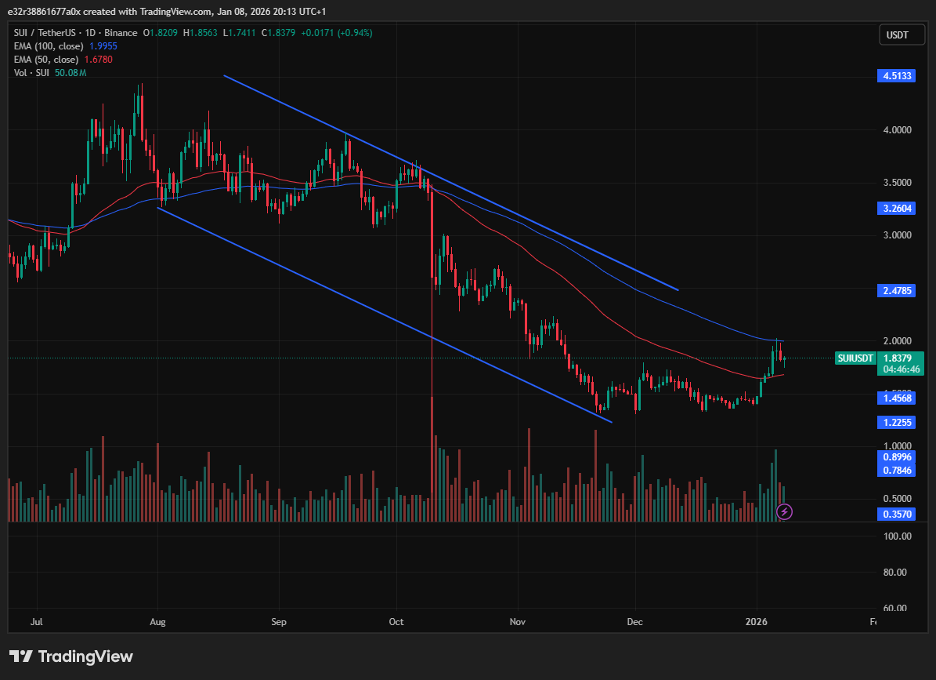
SUI shows a descending channel on daily charts | Source: TradingView
Indicators like the MACD are currently below the signal line. This confirms that the trend is moving against the bulls. The Chaikin Money Flow (CMF) also shows a reading of -0.07, which means that there is mild capital outflow.
In other words, more people are selling than buying right now. While the momentum is not yet in a state of freefall as of writing, the gap between these lines is widening, and traders need to stay alert.
A Look Back at the Early 2026 Recovery
Despite the recent dip, it is important to remember that SUI started the year with a massive 30% surge.
In the first week of the year alone, the token briefly reclaimed the $2.00 level for the first time since November. This rally was a breath of fresh air after a long decline that dominated the second half of last year.
During that time, social interest in the project had fallen by nearly 95% according to data from Santiment.
This recent recovery happened even though online discussion remained very low. Usually, when prices go up without a lot of social media hype, it tends to mean that whales are the only ones buying.
Can SUI Break the Cycle of Decline?
The biggest challenge for the SUI is breaking the long-term downtrend that began last year.
Analysts recently noted that the price had managed to break above a major descending trendline earlier this month.
This was a major win for the bulls, and it showed that the demand zone between $1.00 and $1.20 was strong enough to act as a solid base for future growth.
$SUI is turning out to be a great deal. 👀✔️ https://t.co/hvv6n1lu9d pic.twitter.com/yylhKDE7ST
— Lucky (@LLuciano_BTC) January 6, 2026
Even with the current 1% to 4% daily loss, some technical analysts are still hopeful.
They believe that as long as SUI stays above the $1.50 mark, the “bullish thesis” is still alive.
The daily RSI is currently at 51.49, which means that the market’s momentum is neutral. In other words, the market is in a period of consolidation and investors are playing a waiting game to see if the bulls will step back in.
Disclaimer: The information on this page may come from third parties and does not represent the views or opinions of Gate. The content displayed on this page is for reference only and does not constitute any financial, investment, or legal advice. Gate does not guarantee the accuracy or completeness of the information and shall not be liable for any losses arising from the use of this information. Virtual asset investments carry high risks and are subject to significant price volatility. You may lose all of your invested principal. Please fully understand the relevant risks and make prudent decisions based on your own financial situation and risk tolerance. For details, please refer to
Disclaimer.
Related Articles
Bitcoin Nears a Fragile Bottom As CryptoQuant Warns of Bull Traps
Bitcoin (BTC) is entering another tense stretch, with CryptoQuant warning that the market’s supply-demand imbalance has sharpened in recent weeks and now looks less like a clean reset and more like the kind of messy deterioration that can trap late buyers. In its latest note, the analytics firm
BlockChainReporter14m ago
Did Donald Trump Just Kill Crypto Innovation? Here’s What Happened With Stablecoin Yield
The crypto market is reacting strongly to new political news, and this time it’s about stablecoin yield. Many traders believe a new draft of the U.S. Clarity Act could seriously limit how stablecoins generate returns, and that has already started to affect the market.
One of the biggest reacti
CaptainAltcoin18m ago
FTX Bankruptcy Liquidation's Unexpected Creation of a "Hedge Fund Harvesting Manual": Why Altcoins Lost to Bitcoin in Nearly Every Way from 2023-2025
FTX's bankruptcy liquidation created a new type of asset trading, where hedge funds achieve stable high returns by purchasing locked tokens at a discount and shorting them in the futures market, while retail investors become liquidity providers, leading to poor cryptocurrency market performance from 2023-2025. Bitcoin benefits from structural advantages due to its transparent supply and absence of locked tokens.
ChainNewsAbmedia24m ago
ETH SuperTrend Turns Green but $2,400 Stays Unbroken
_Ethereum’s daily SuperTrend flipped bullish for the first time since May 2024, but $2,400 resistance keeps blocking any real breakout attempt. Is ETH ready?_
Ethereum ran into a wall. Again. After weeks of grinding between $1,750 and $2,150, ETH finally broke above the range ceiling, pushed into t
LiveBTCNews28m ago
Why XRP Price Risks Further Decline Despite Recovery Signs
Recent XRP price action shows a market that looks steady on the surface but still carries underlying pressure. XRP currently trades around $1.43, up about +0.70% over the past 24 hours and roughly +2.33% across 30 days, yet it remains down about 3.97% over the past week.
That mixed
CaptainAltcoin47m ago
