
**Date: **Sat, Jan 03, 2026 | 01:26 PM GMT
As 2026 kicks off, the broader cryptocurrency market is showing renewed stability. Ethereum (ETH) has reclaimed the $3,100 level, and several major altcoins are already beginning to pick up momentum. Against this improving backdrop, Kaspa (KAS) is quietly positioning itself as a potential late mover, with its chart structure starting to flash early bullish signals.
While KAS is trading slightly in the red today and remains mostly flat on the weekly timeframe, the more important story is unfolding beneath the surface. Recent price action suggests a meaningful structural shift may be underway — one that could mark the early stages of a bullish continuation if confirmed.
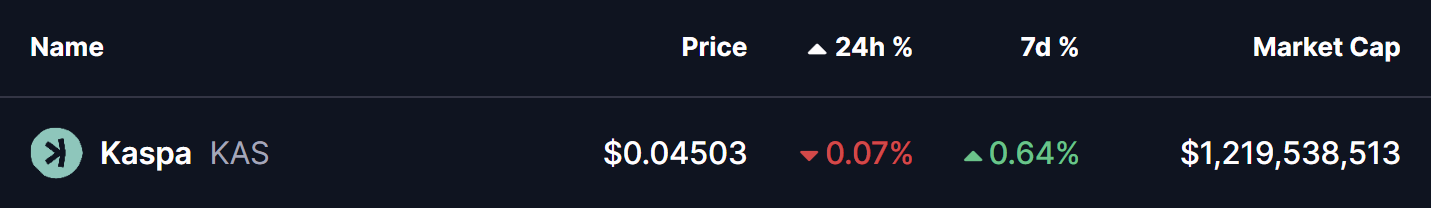
Source: Coinmarketcap
Rounding Bottom in Play
On the 4-hour timeframe, Kaspa appears to be forming a rounding bottom pattern, a classic bullish reversal structure that typically develops after a prolonged corrective phase. This pattern reflects a slow but steady transition from distribution to accumulation, as selling pressure weakens and buyers gradually regain control.
The setup began after KAS faced strong rejection near the $0.06310 neckline zone, which triggered a sharp decline through late November and December. That downside move eventually found strong demand near the $0.040 level, which has since acted as a key support area. Multiple defenses of this zone prevented further downside and helped establish a stable base for a potential trend reversal.
Since carving out that bottom, KAS has started to curve higher in a smooth, rounded fashion — closely matching the textbook structure of a developing rounding bottom. The recent stabilization above the $0.045 region further supports the idea that downside momentum is fading.
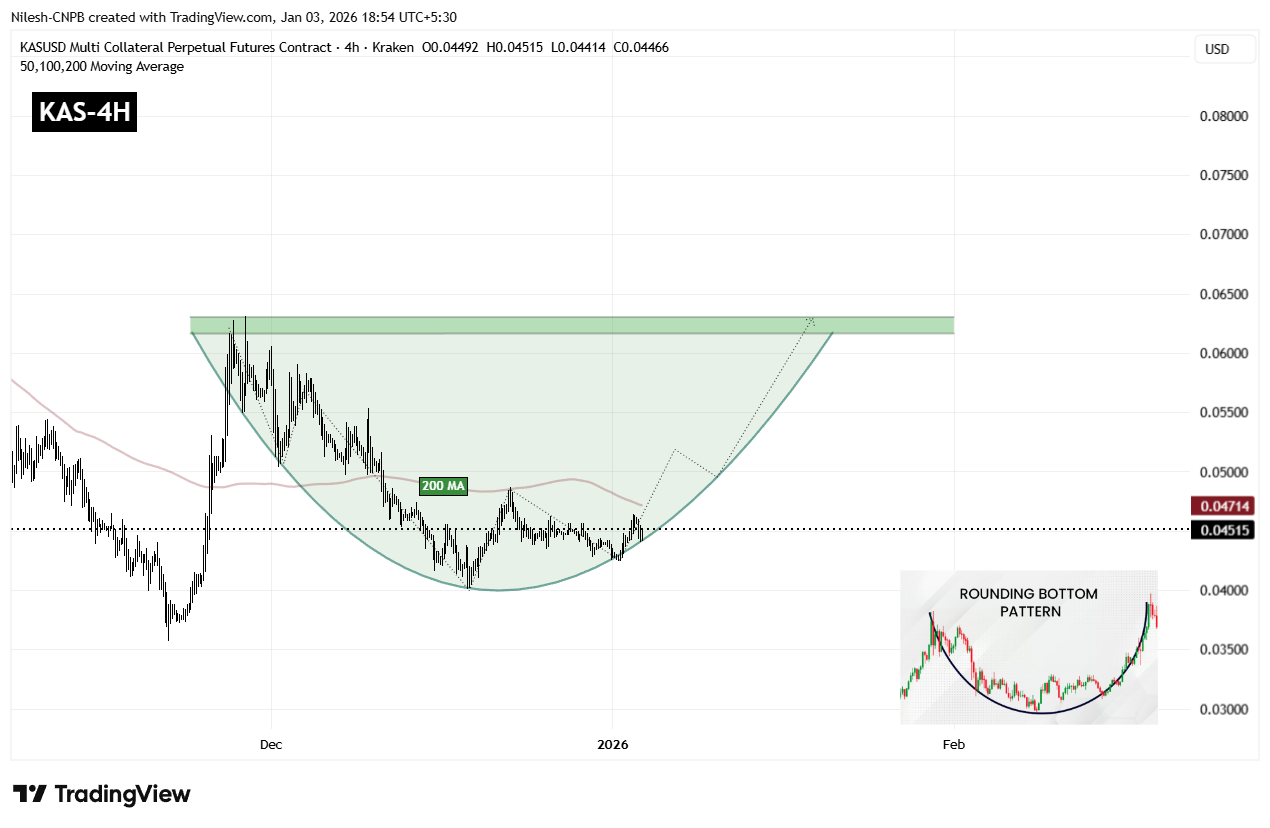
Kaspa (KAS) 4H Chart/Coinsprobe (Source: Tradingview)
A key technical level now comes into focus: the 200-period moving average, currently hovering near $0.04714. This level has acted as dynamic resistance during the recovery phase, and reclaiming it would mark an important shift in short-term market structure.
A sustained move above the 200 MA would indicate that buyers are regaining control after months of corrective price action and could act as the trigger for a stronger upside continuation.
What’s Next for KAS?
For full confirmation of the rounding bottom pattern, KAS must eventually reclaim the $0.06310 neckline resistance. A clean breakout above this zone would validate the entire reversal structure and could open the door to a broader bullish expansion phase, with momentum traders likely re-entering the market.
Until that breakout occurs, the pattern remains in development. Short-term consolidation or shallow pullbacks remain possible, especially near moving average resistance. However, as long as price continues to hold above the $0.04245 support base and maintains higher lows, the broader bottoming structure remains intact and constructive.
In the near term, all eyes remain on the 200 MA and the neckline zone. How Kaspa reacts around these levels will likely determine whether this emerging bullish setup evolves into a confirmed breakout move or requires more time to mature.
Disclaimer: The views and analysis presented in this article are for informational purposes only and reflect the author’s perspective, not financial advice. Technical patterns and indicators discussed are subject to market volatility and may or may not yield the anticipated results. Investors are advised to exercise caution, conduct independent research, and make decisions aligned with their individual risk tolerance.
About Author: Nilesh Hembade is the Founder and Lead Author of Coinsprobe, with over 5 years of experience in the cryptocurrency and blockchain industry. Since launching Coinsprobe in 2023, he has been providing daily, research-driven insights through in-depth market analysis, on-chain data, and technical research.
Disclaimer: The information on this page may come from third parties and does not represent the views or opinions of Gate. The content displayed on this page is for reference only and does not constitute any financial, investment, or legal advice. Gate does not guarantee the accuracy or completeness of the information and shall not be liable for any losses arising from the use of this information. Virtual asset investments carry high risks and are subject to significant price volatility. You may lose all of your invested principal. Please fully understand the relevant risks and make prudent decisions based on your own financial situation and risk tolerance. For details, please refer to
Disclaimer.
Related Articles
Gate Daily Report (March 23): MicroStrategy Releases Bitcoin Buy Signal; MajiDaBro's ETH Liquidation Incurs Losses of 30.35 Million
Bitcoin has continued to decline to around $67,950, with MicroStrategy founder Michael Saylor reiterating a buy-the-dip strategy. Huang Licheng's highly leveraged ETH position was completely liquidated, with losses exceeding $30.35 million. Fidelity has called on the US SEC to improve its regulatory framework for crypto assets. US stocks have broadly declined, and market sentiment remains cautious.
MarketWhisper47m ago
Scaramucci: Bitcoin Halving Cycle Remains Intact, Q4 Bull Market About to Resume
SkyBridge Investment Company partner Scaramucci stated that Bitcoin's four-year halving cycle remains effective, with the current bear market representing a normal pullback, predicting another bull market for Bitcoin in 2026. The market's collective belief is self-fulfilling, and pessimistic sentiment similar to historical patterns could present entry opportunities. Although institutional investors influence cyclical volatility, the fundamental nature of the halving cycle has not changed.
MarketWhisper1h ago
Why Did Bitcoin Fall Today? Trump's 48-Hour Ultimatum Triggers Market Panic
Bitcoin declined to $67,979.57 today, primarily affected by US-Iran tensions, higher-than-expected US PPI data, and whale short-selling activity. Global markets face stagflation pressure, with $70,000 serving as a key support level. If this level is breached, prices could potentially decline to $68,000.
MarketWhisper1h ago
Cryptocurrency Fear and Greed Index Falls to 8 Today, Market Extreme Panic Sentiment Deepens
Gate News reported that on March 23rd, according to Alternative.me data, today's cryptocurrency fear and greed index fell to 8, declining further from yesterday's 10. The index indicates the market is currently in a state of extreme panic, with panic sentiment continuing to deepen.
GateNews2h ago
The Hormuz Strait crisis remains unresolved, and Bitcoin has fallen below 68K.
Affected by the US-Iran conflict, global markets have been severely impacted, with the S&P 500 Index declining for four consecutive weeks. Gold has experienced a modest rebound around $4,500, while oil prices remain stable at elevated levels. Trump has issued an ultimatum to Iran, with potential escalation of conflict between the two sides. Bitcoin and Ethereum have also declined in tandem, and market sentiment has turned conservative.
ChainNewsAbmedia2h ago
