
As the new year 2026 begins, the broader cryptocurrency market has shown modest strength over the past few hours, with both Bitcoin (BTC) and Ethereum (ETH) turning slightly green. This improvement in sentiment has started to spill over into the altcoin market as well, with several tokens attempting to build upward momentum — including Render (RENDER).
RENDER is currently up around 4% on the day, but the more compelling development lies beneath the surface. On lower timeframes, price action is beginning to highlight a constructive bullish structure that could soon pave the way for a meaningful breakout if confirmed.
Source: Coinmarketcap
Ascending Triangle Structure Takes Shape
On the 4-hour chart, RENDER appears to be forming a textbook ascending triangle, characterized by a sequence of higher lows pressing steadily against a well-defined horizontal resistance zone. This structure is widely viewed as a bullish continuation pattern, particularly when it develops after a period of consolidation and shows signs of accumulation.
RENDER recently faced rejection near the $1.36 neckline resistance, which pushed price back toward its rising support trendline around the $1.28 region. However, each pullback has been met with strong buying interest, keeping the pattern intact and preventing any deeper breakdown. This behavior suggests that sellers are gradually losing control as buyers continue to step in at higher levels.
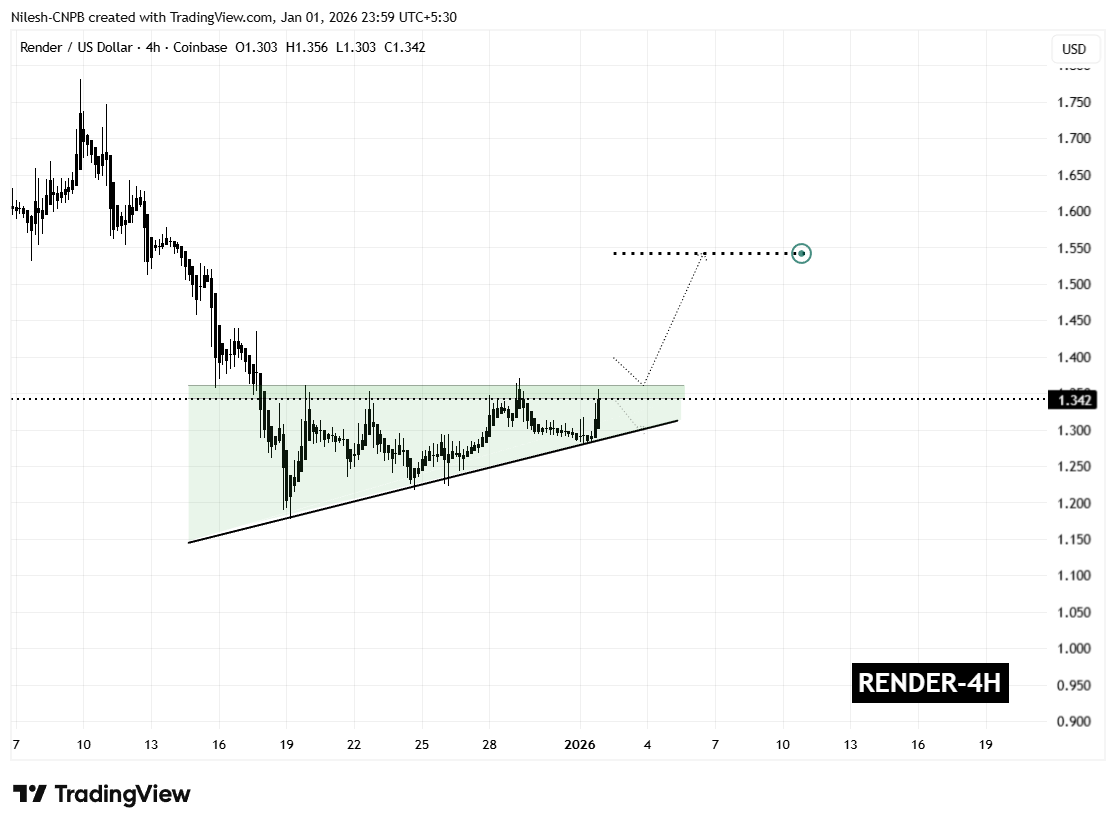
Render (RENDER) 4H Chart/Coinsprobe (Source: Tradingview)
The latest rebound has carried RENDER back toward the upper boundary of the pattern, reinforcing the idea that demand remains firm. Rather than signaling weakness, this price action points to healthy consolidation as the market tightens ahead of a potential breakout.
What’s Next for RENDER?
From here, RENDER appears to be preparing for another test of the $1.36 resistance zone. A confirmed breakout and sustained close above this level, ideally followed by a successful retest as support, would validate the ascending triangle structure and likely trigger a bullish expansion phase.
Based on the measured move of the pattern, the technical upside projection points toward the $1.54 region. This target represents a potential upside of roughly 14% from current levels and also aligns with previous price structure, strengthening the bullish case.
That said, caution remains warranted. A failure to break above resistance could result in a pullback toward the rising support trendline. As long as that trendline continues to hold, the broader bullish structure would remain intact. A decisive breakdown below support, however, would invalidate the pattern and delay any breakout scenario.
For now, the combination of improving market sentiment, persistent buying pressure, and a tightening ascending triangle structure suggests that Render is approaching a critical decision point — one that could define its next significant move as 2026 gets underway.
Disclaimer: The views and analysis presented in this article are for informational purposes only and reflect the author’s perspective, not financial advice. Technical patterns and indicators discussed are subject to market volatility and may or may not yield the anticipated results. Investors are advised to exercise caution, conduct independent research, and make decisions aligned with their individual risk tolerance.
About Author: Nilesh Hembade is the Founder and Lead Author of Coinsprobe, with over 5 years of experience in the cryptocurrency and blockchain industry. Since launching Coinsprobe in 2023, he has been providing daily, research-driven insights through in-depth market analysis, on-chain data, and technical research.
Disclaimer: The information on this page may come from third parties and does not represent the views or opinions of Gate. The content displayed on this page is for reference only and does not constitute any financial, investment, or legal advice. Gate does not guarantee the accuracy or completeness of the information and shall not be liable for any losses arising from the use of this information. Virtual asset investments carry high risks and are subject to significant price volatility. You may lose all of your invested principal. Please fully understand the relevant risks and make prudent decisions based on your own financial situation and risk tolerance. For details, please refer to
Disclaimer.
Related Articles
Trump's Ultimatum to Iran Fails to Materialize, BTC Stabilizes After Breaking Below $70,000 Over the Weekend
QCP Group points out that Trump's ultimatum to Iran failed to materialize, and the market stabilized briefly. Despite BTC breaking below 70,000, its resilience has strengthened. With U.S. national debt exceeding 3.9 trillion, stagflation concerns intensify, and central banks face policy dilemmas. Iran proposed settling transit fees in yuan, and the market should monitor shifts in BTC.
GateNews38m ago
Crypto Analyst Hints at ADA Price Uptick Based on Weekly Chart
Crypto analyst Ali Charts predicts a potential rise in ADA prices, currently up 5.50% in the last 24 hours. He suggests the token may surge further over the next three months based on historical price patterns and current market analysis.
TheNewsCrypto53m ago
BCH Shows Promising Buy Signal Traders Can’t Ignore
BCH holds key $440 support, showing potential for a short-term rebound.
The 4-hour chart indicates bullish flip with strong OBV and DMI signals.
Next targets lie at $494, $510, and possibly $570 if Bitcoin rises further.
Bitcoin Cash — BCH, has captured traders’ attention this week with
CryptoNewsLand1h ago
QNT Rally Tests a Crucial Supply Zone — What Next for Quant?
QNT rallied 24% weekly, testing a key supply zone near $80–$88.
Daily closes above $88 signal bullish continuation, while drops below $75 indicate renewed bearish pressure.
Short-term momentum is positive, but higher timeframe indicators suggest cautious trading.
Quant — QNT, has
CryptoNewsLand1h ago
Gold, Bonds, and Bitcoin: The Three Major Truth Revealers of Financial Markets
The article analyzes the recent performance of gold, bonds, and Bitcoin in current financial markets and the reasons behind it. Recently, rising bond yields, falling gold prices, and rising Bitcoin have demonstrated the market's reaction to uncertainty. Particularly in the Iran conflict, a liquidity crisis led to gold selloffs, while Bitcoin, as a non-sovereign asset, has gained favor. Looking ahead, oil prices are expected to continue rising, putting pressure on bonds and gold, with Bitcoin outperforming other assets. Financial markets will be significantly influenced by geopolitical factors.
金色财经_1h ago
Zcash News: Smart money quietly increasing holdings after ZEC's 55% pullback; the key breakout level is at $227
Zcash (ZEC) is currently oscillating around $226, facing pressure from a descending channel. Despite the appearance of bullish divergence and increased holdings by some investors, the market remains predominantly bearish. If it holds the $227 support level, it could potentially rally to targets such as $267; if it breaks below, it may test $191. Core factors include the stability of support levels and capital flow dynamics.
GateNews1h ago
