
Key Takeaways
-
Hyperliquid (HYPE) has dropped over 19% on the week, with price stabilizing near a critical demand zone.
-
The $19.22–$19.55 support area is emerging as a key level where sellers may lose control.
-
A bearish Shark harmonic pattern is forming on the daily chart, hinting at a potential rebound if support holds.
-
Strong token burns and notable whale buying are acting as a contrarian signal amid broader weakness.
-
A reclaim of the 50-day moving average near $26.39 could confirm a bullish recovery phase.
Hyperliquid’s native token, HYPE, remains under sustained selling pressure as bearish momentum continues to dominate short-term price action. As of January 21, HYPE is trading nearly 9% lower on the day, extending its weekly decline to over 19%. The token is currently hovering around the $20.65 region, an area that is quickly becoming a decisive technical battleground.
While the chart reflects heavy downside pressure, a mix of aggressive supply reduction, strategic buying, and an emerging harmonic structure is raising the question: Is a rebound quietly setting up beneath the surface?
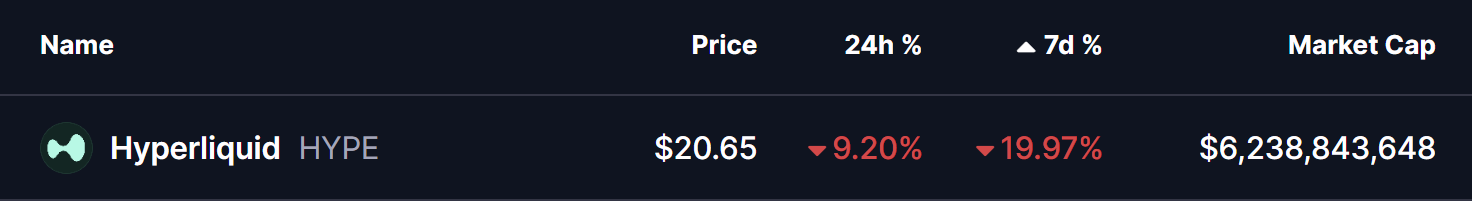
Source: Coinmarketcap
Burn and Buying Add a Contrarian Signal
Despite the ongoing price weakness, on-chain activity tells a more nuanced story.
As of January 21, Hyperliquid’s assistance fund burned 39 million HYPE tokens, permanently removing roughly 3.9% of the maximum supply from circulation. At the same time, notable buyers stepped in during the sell-off.
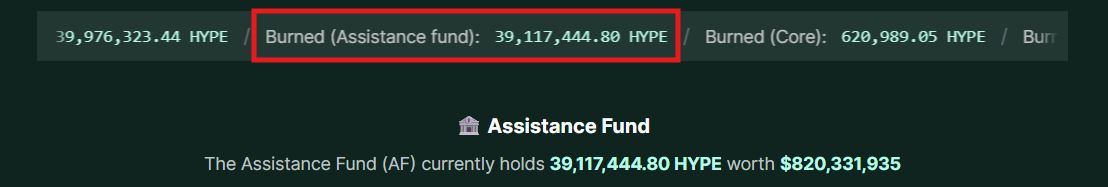
Source: hypeburn
-
Arthur Hayes reportedly purchased** 19,000 HYPE**
-
The assistance fund itself continues to buy aggressively, paying prices over 50% higher than current market levels
This combination of sustained burning and dip-buying suggests growing long-term conviction, even as short-term sentiment remains fragile.
Could This Emerging Pattern Trigger a Rebound?
From a technical perspective, the daily chart shows HYPE entering the early stages of a bearish Shark harmonic pattern.
After completing the O-X-A leg, price rolled over and is now pressing toward the projected B-point support zone between $19.22 and $19.55. This area is highlighted on the chart as a historically reactive demand zone and could mark a potential exhaustion point for sellers.
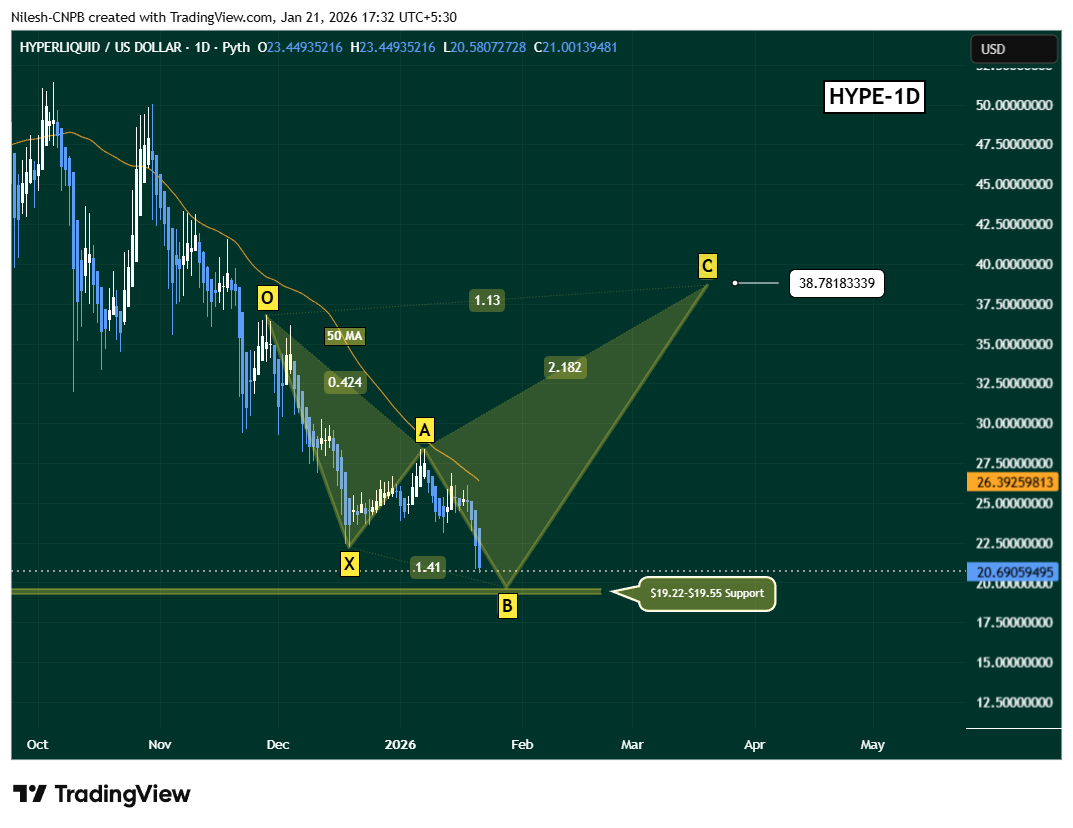
Hyperliquid (HYPE) Daily Chart/Coinsprobe (Source: Tradingview)
If buyers step in around this support and price begins to stabilize, the next key technical hurdle would be a reclaim of the 50-day moving average near $26.39. A decisive move back above this level would strengthen the rebound thesis and open the door for a recovery move toward the C-point near $38.7, where the Shark pattern’s projected extension sits around the 1.13 level.
What’s Next for HYPE?
For now, the pattern remains in development, not confirmed. The coming sessions will be critical.
-
Holding the $19.22–$19.55 zone would keep the harmonic setup alive
-
Rising volume and stronger daily closes could signal buyer commitment
-
A break back above the 50-day MA would act as early confirmation of a trend shift
On the downside, a failure to hold the lower support zone would invalidate the pattern and leave HYPE vulnerable to deeper consolidation.
For now, Hyperliquid sits at a technical inflection point, where intense selling pressure collides with supply destruction and early structural support. Whether this develops into a meaningful rebound or another leg lower will depend on how price reacts at the lower boundary in the days ahead.
Disclaimer: The views and analysis presented in this article are for informational purposes only and reflect the author’s perspective, not financial advice. Technical patterns and indicators discussed are subject to market volatility and may or may not yield the anticipated results. Investors are advised to exercise caution, conduct independent research, and make decisions aligned with their individual risk tolerance.
About Author: Nilesh Hembade is the Founder and Lead Author of Coinsprobe, with over 5 years of experience in the cryptocurrency and blockchain industry. Since launching Coinsprobe in 2023, he has been providing daily, research-driven insights through in-depth market analysis, on-chain data, and technical research.
Disclaimer: The information on this page may come from third parties and does not represent the views or opinions of Gate. The content displayed on this page is for reference only and does not constitute any financial, investment, or legal advice. Gate does not guarantee the accuracy or completeness of the information and shall not be liable for any losses arising from the use of this information. Virtual asset investments carry high risks and are subject to significant price volatility. You may lose all of your invested principal. Please fully understand the relevant risks and make prudent decisions based on your own financial situation and risk tolerance. For details, please refer to
Disclaimer.
Related Articles
Dogecoin Price Heads Toward $1 Mark as Elon Musk Stirs Up New Speculation
Dogecoin (DOGE) once again came into the spotlight after Elon Musk revived the "DogeFather" image on the X platform. The post describes him in the style of a classic film character, replacing the familiar cat with an image of a Shiba Inu dog – the symbol of DOGE.
The image was created by Grok Imagine
TapChiBitcoin15m ago
Artificial Superintelligence Alliance (FET) makes a comeback thanks to the increasing flow of whale accumulation.
The Artificial Superintelligence Alliance (FET) has seen a significant recovery, maintaining above $0.230, supported by on-chain data and positive signals from the derivatives market. Whale accumulation and increased open interest highlight a bullish trend, with market sentiment favoring price growth.
TapChiBitcoin1h ago
Gold Plunges Below 4500! Stocks, Bonds, and Gold All Selling Off—Is Cash Really the Safe Haven King?
Gold has declined to $4,500 since late February 2026 due to geopolitical conflicts, with global capital markets in turmoil, the S&P 500 down 5%. U.S. Treasury yields are rising, safe-haven assets are underperforming, and capital flows into money market funds have reached historic highs, indicating a market preference for "cash is king." Bitcoin is experiencing volatility and has not yet established itself as a safe-haven asset.
ChainNewsAbmedia3h ago
Today the cryptocurrency fear and greed index rose to 12, with the market in a state of extreme panic.
Gate News Update: On March 21st, according to Alternative.me data, the Cryptocurrency Fear and Greed Index rose to 12 today (the index was 11 yesterday), with the market in an "extreme panic state."
GateNews3h ago
Canton (CC) Price in a Downtrend – Analyst Says the Drop Isn’t Over
Sometimes the market tells you exactly what it’s going to do. You just have to be paying attention. For Canton, the story has been pretty clear for a while now. Down, and then more down.
Sjuul from AltCryptoGems caught this one early. He spotted that bearish rejection just in time, and since t
CaptainAltcoin4h ago
