
Key Takeaways
-
Monad (MON) has dropped nearly 41% over the past two months but is showing early signs of stabilization.
-
Price action suggests a potential double bottom pattern forming near the $0.018 support zone.
-
Buyers have repeatedly defended the same support level, hinting at fading selling pressure.
-
A move above the 50-day moving average could strengthen the short-term bullish outlook.
-
A confirmed breakout above the $0.02970 neckline may open the door for a stronger recovery rally.
Monad (MON), the native token of the Monad Layer-1 blockchain, has been under pressure in recent weeks. The token is down roughly 41% over the past 60 days, driven by a slowdown in TVL growth and a decline in application-level revenue across the ecosystem.
However, sentiment may be starting to shift. MON posted a 12% bounce today, and more importantly, its price structure on the daily chart is beginning to show early signs of a bullish reversal — suggesting the downside momentum could be losing steam.
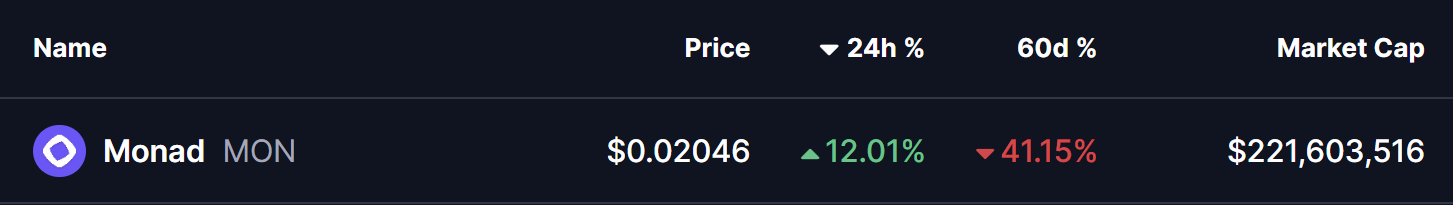
Source: Coinmarketcap
Double Bottom Pattern in Play
On the daily timeframe, MON appears to be forming a potential double bottom pattern, a classic bullish reversal structure that often develops near the end of extended downtrends.
The first bottom was formed when MON dropped toward the $0.018 support zone, followed by a rebound that carried price back toward the neckline resistance near $0.02970. That recovery attempt was rejected, sending MON back down to retest the same support level.
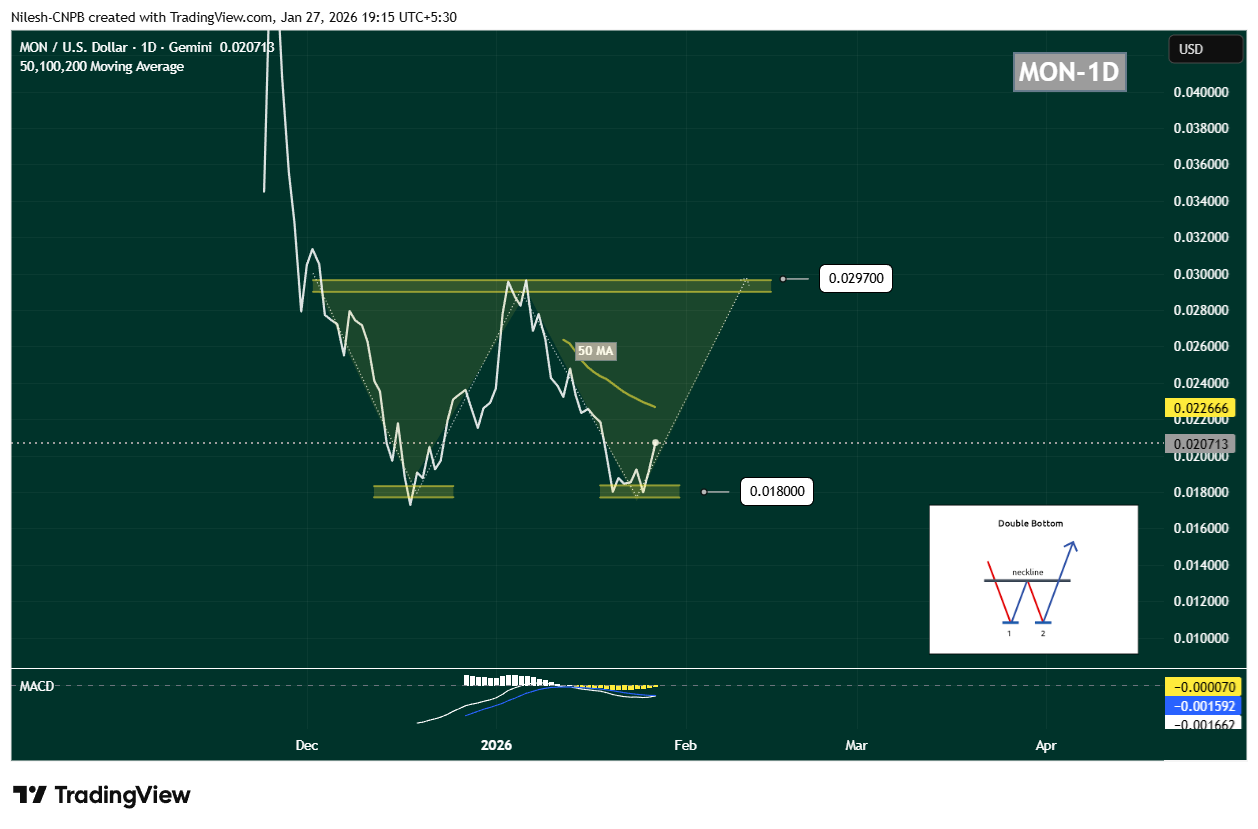
Monad (MON) Daily Chart/Coinsprobe (Source: Tradingview)
What’s notable this time is buyer behavior. Once again, demand emerged around $0.018, preventing a breakdown and forming the second bottom of the structure. MON is currently trading near $0.02071, indicating that selling pressure may be fading.
Momentum indicators are starting to support this view. The MACD is showing early signs of a potential bullish crossover, often seen as an initial signal that downside momentum is weakening and buyers may be preparing to step back in.
What’s Next for Monad (MON)?
For this bullish setup to gain credibility, MON needs to reclaim the 50-day moving average, which is currently positioned near $0.02266. A sustained move above this level would signal a shift in short-term momentum and improve the probability of a recovery rally.
If buyers manage to push price back toward the $0.02970 neckline, the market will be watching closely. A decisive breakout above this resistance, ideally followed by a successful retest, would confirm the double bottom pattern and open the door for a stronger upside move.
On the downside, the $0.018 support zone remains the most critical level to defend. A breakdown below this area would invalidate the bullish structure and likely expose MON to another leg of downside or extended consolidation.
Bottom Line
Despite recent weakness, MON’s technical structure is starting to look constructive. The repeated defense of identical lows, the emergence of a double bottom pattern, and improving momentum signals suggest that Monad could be approaching a potential turning point.
If key support continues to hold and the token reclaims its short-term moving averages, MON may be setting the stage for a recovery phase — especially if broader market conditions stabilize in the days ahead.
Disclaimer: The views and analysis presented in this article are for informational purposes only and reflect the author’s perspective, not financial advice. Technical patterns and indicators discussed are subject to market volatility and may or may not yield the anticipated results. Investors are advised to exercise caution, conduct independent research, and make decisions aligned with their individual risk tolerance.
About Author: Nilesh Hembade is the Founder and Lead Author of Coinsprobe, with over 5 years of experience in the cryptocurrency and blockchain industry. Since launching Coinsprobe in 2023, he has been providing daily, research-driven insights through in-depth market analysis, on-chain data, and technical research.
Disclaimer: The information on this page may come from third parties and does not represent the views or opinions of Gate. The content displayed on this page is for reference only and does not constitute any financial, investment, or legal advice. Gate does not guarantee the accuracy or completeness of the information and shall not be liable for any losses arising from the use of this information. Virtual asset investments carry high risks and are subject to significant price volatility. You may lose all of your invested principal. Please fully understand the relevant risks and make prudent decisions based on your own financial situation and risk tolerance. For details, please refer to
Disclaimer.
Related Articles
Altcoins Are Currently Building Towards a Most Bullish Cup and Handle Pattern Formation
Altcoins are currently building towards a most bullish pattern.
Analysts marks a huge cup and handle formation on the altcoin price chart.
Chances for altseason arrival grows stronger.
The crypto market continues to move sideways, and today it is trading on the lower spectrum. To
CryptoNewsLand44m ago
Fractal data: The price of TAO on Bittensor could drop sharply by 40% within five weeks.
Bittensor (TAO) recently surged 160%, but signs of weakness are appearing with a golden cross formation, historically leading to significant pullbacks. Past instances suggest a potential 40% decline in the coming weeks, amidst overbought conditions and macroeconomic pressures. Despite increased discussions surrounding TAO, investor sentiment remains cautious.
TapChiBitcoin1h ago
The Iran conflict drove Ethereum to rise against the trend, and Tom Lee advised selling gold to buy cryptocurrencies
Since the war between the U.S. and Iran began at the end of February, Ethereum has performed exceptionally well, outperforming several major assets. Fundstrat's research shows that Ethereum has risen 17% against the S&P 500, and Tom Lee believes it has significant potential as a risk-averse asset. He predicts that Ether could rise to $250,000, and multiple institutions are optimistic about investing in it. Currently, the price of Ethereum is fluctuating around $2,000, with market attention continuously increasing.
GateNews1h ago
Zilliqa faces downward pressure as bears dominate the market.
Zilliqa (ZIL) has dropped below $0.0040, indicating market weakness. On-chain data and derivatives suggest a bearish trend, with increasing selling pressure and a negative funding rate indicating further downside risk in the near future.
TapChiBitcoin1h ago
Dogecoin (DOGE) falls, attracting whales to buy in, while ETF investors remain inactive.
Dogecoin has fallen over 5% in the past 24 hours, with a price around $0.091, and the total market capitalization has decreased to approximately $2.4 trillion. Technical indicators show increased short-term selling pressure, with support around $0.092. Although institutions remain cautious, some retail investors are seizing the opportunity to buy, and there is still hope for a breakout above $0.10. Additionally, Qubic plans to launch Dogecoin mining on April 1, which could bring new vitality to its ecosystem.
GateNews1h ago
