
RENDER is finally showing signs of a shift on the 4-hour chart. After weeks of grinding lower inside a falling wedge, price has pushed through the upper trendline and now, it moves away from it. That matters, because this kind of structure usually breaks when selling pressure runs out instead of when sellers are in control.
What stands out is how the breakout played out. Volatility had been tightening, price action was compressing, and each sell-off was doing less damage than the last. Once buyers stepped in, the RENDER price broke higher and did not slip back into the wedge immediately…
- Why This RENDER Falling Wedge Break Is Getting Attention
- The RENDER Daily Chart Adds Confirmation
- What Needs to Happen Next
Why This RENDER Falling Wedge Break Is Getting Attention
On the 4-hour chart shared by Clifton a falling wedge is showing up and this normally happens near the end of corrective phases, and that seems to be the case here.
Even though the RENDER price was still printing lower highs, the downside momentum was fading. Sellers were pushing, but they were not getting much in return.
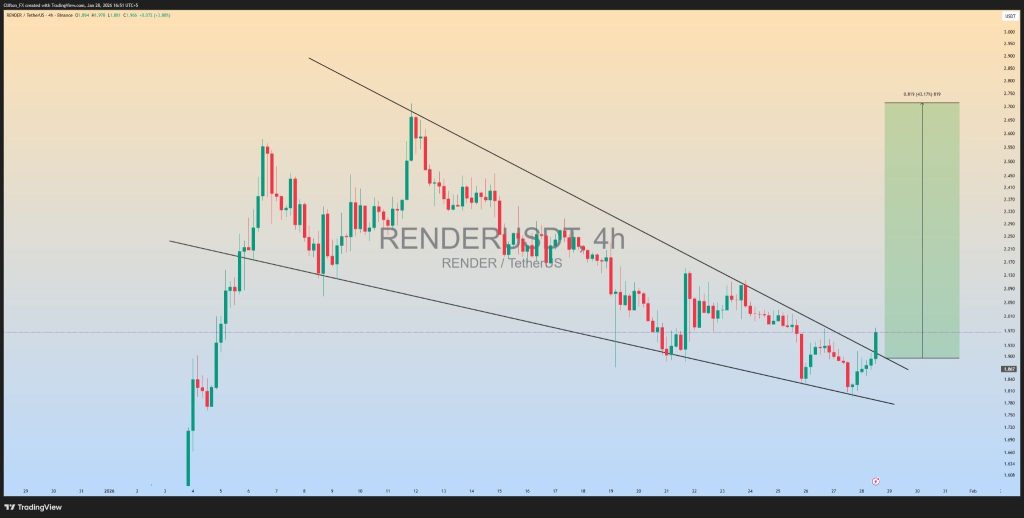
Source: X/@clifton_ideas
Once price cleared the top of the wedge, it opened space for a broader move. The upside projection on the chart highlights how much room the RENDER price could have if momentum continues to build.
It does not mean price shoots straight up, but it does show that this breakout is coming from a compressed base and not an overheated rally. As long as the RENDER price stays above the former wedge resistance, the breakout structure remains valid.
The RENDER Daily Chart Adds Confirmation
The daily chart helps put the move into context. The RENDER price dipped into a key Fibonacci support zone between $1.75 and $1.85, briefly tagging around $1.81 before buyers stepped in.
The price didn’t continue going lower, it quickly bounced back above $1.90, which is exactly what a clean support test usually looks like.
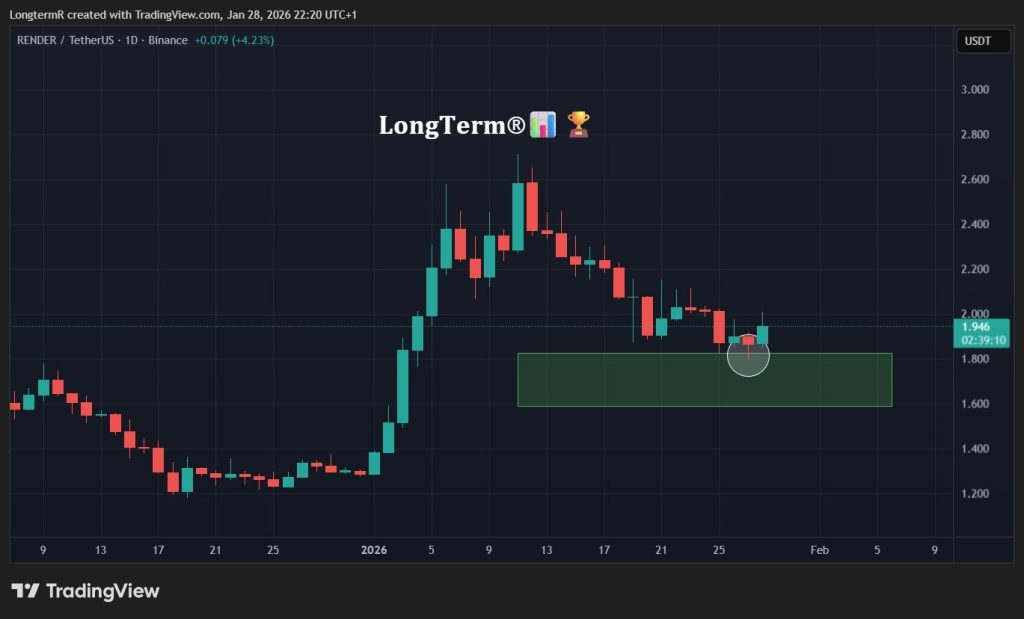
Source: X/@LongTermR
That kind of response suggests there was real demand waiting at those levels. It also supports the idea that this pullback was more of a reset than the beginning of a deeper decline, especially with buyers stepping in so decisively.
With the daily bounce lining up nicely with the 4-hour breakout, the RENDER price continues to hold a constructive structure as long as it stays above the $1.80 zone.
Kaspa (KAS) Price Prediction for February: Recovery Remains Unlikely_**
What Needs to Happen Next
Right now, the RENDER price is sitting at a clear decision point. The 4-hour chart is building steam, and on the daily chart, the support continues to hold at the critical price range of $1.80–$1.85.
In order to sustain the bullish view, the price needs to hold above the recent higher low at $1.81 and not fall back below the former breakout range at $1.85. As long as that happens, the structure remains constructive.
However, if the buyers continue to be on the upper end, RENDER could continue to move towards even stronger resistance levels of $2.10 and $2.30, which were out of reach during the fall.
But if the support levels continue to fall, the chances are that the stock will continue to move sideways between $1.75 and $1.95. The momentum is changing, and the key will be to see if the stock can move above $2.00 and hold on to the level.
Disclaimer: The information on this page may come from third parties and does not represent the views or opinions of Gate. The content displayed on this page is for reference only and does not constitute any financial, investment, or legal advice. Gate does not guarantee the accuracy or completeness of the information and shall not be liable for any losses arising from the use of this information. Virtual asset investments carry high risks and are subject to significant price volatility. You may lose all of your invested principal. Please fully understand the relevant risks and make prudent decisions based on your own financial situation and risk tolerance. For details, please refer to
Disclaimer.
Related Articles
Rising oil prices spark heated discussion in the crypto community: Will Bitcoin become an inflation hedge?
International oil price fluctuations have sparked heated discussions in the crypto community, focusing on the impact of oil prices on Bitcoin trends. Analysts believe that geopolitical risks and inflation pressures have made oil a focal point, with some traders expressing concern about Bitcoin's safe-haven properties, though doubts remain. Currently, market interest in altcoins is subdued, with main attention on macroeconomic trends and commodity movements.
GateNews2m ago
XRP Price Breakout Signal Appears: Symmetrical Triangle Critical Point Approaching, $2 Target May Come Into View
XRP price has recently rebounded by approximately 4%, approaching a breakout of a key technical pattern. The market is watching to see if it will break through the upper boundary of the symmetrical triangle, with a potential target price of $2.06. Although the growth in stablecoin supply has boosted market sentiment, outflows of institutional funds warrant caution. The current trend still requires close monitoring.
GateNews11m ago
Cardano Posts 6.89% Daily Gain—Can ADA Maintain Momentum Above $0.25?
Cardano posts 6.89% daily gain as ADA rebounds to $0.2811 after recent yearly lows.
Strong trading volume signals renewed investor interest and potential short-term momentum.
Traders watch $0.25 support and $0.30 resistance for ADA’s next direction.
Cardano’s ADA returned to the
CryptoNewsLand21m ago
Circle stock price surges 87% in a month! How the US-Iran war and trader position adjustments are driving the rally?
Circle's stock price surged 87% in a single month due to the impact of the US-Iran conflict. Analysts have pointed out that its stock is overvalued, and the discounted cash flow model shows an intrinsic value of $42.25. The current stock price of $111.84 is 164.7% higher. The price-to-sales ratio also emphasizes that the stock is overvalued, indicating a high risk of overestimation.
CryptoCity26m ago
"1011 Insider Whale" Agent: Brent Crude Oil remains in the first phase, and whether the Strait of Hormuz is open or not is a key variable
Gate News reports that agent Garrett stated that Brent crude oil remains in the first stage, and market dynamics have not substantively changed. The key issue is whether the Strait of Hormuz will remain open; continued restrictions will impact the energy market.
GateNews27m ago
Bitcoin bottom signals reappear? Analysts say "simple mathematical model" may indicate key support for a new cycle
Recently, crypto analyst Chetan Gurjar reviewed the analytical framework that successfully identified the 2022 bear market bottom, emphasizing Bitcoin's response within the long-term structure. He believes that if it breaks through the current resistance zone, it could form a new cycle bottom and influence future trends.
GateNews29m ago