
Key Takeaways
-
SKY is forming a rounding bottom pattern on the daily chart
-
Price has rebounded strongly from the $0.0419 demand zone
-
Rising volume supports improving bullish momentum
-
A breakout above $0.0778 could confirm trend reversal
-
Pattern projection points toward the $0.11 region
Sky (SKY), the native governance and utility token of the Sky Protocol (formerly MakerDAO), has stepped into the spotlight after posting a strong daily move of over 8%, accompanied by a sharp 35% surge in trading volume. While the short-term momentum is drawing attention, the more compelling story is unfolding on the higher timeframe chart.
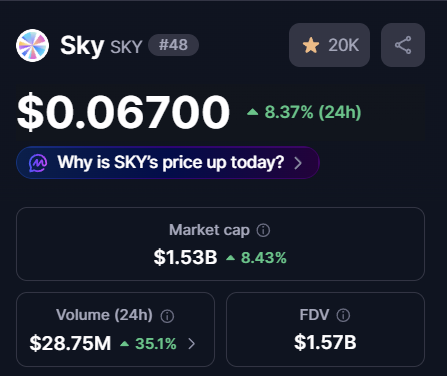
Source: Coinmarketcap
Price action is now forming a classic bullish reversal structure — one that often signals the transition from prolonged weakness into a new recovery phase.
Rounding Bottom Pattern Signals Trend Shift
On the daily timeframe, SKY appears to be completing a rounding bottom formation, a well-known bullish reversal pattern that typically develops after extended downtrends. This structure reflects a gradual shift in market psychology, where persistent selling pressure slowly fades and long-term accumulation begins to dominate.
Earlier in the trend, SKY faced repeated rejection near the $0.0778 neckline resistance, which triggered a steep sell-off. That decline ultimately bottomed near $0.0419, marking a critical demand zone where buyers aggressively stepped in and prevented further downside.
Since establishing this low, price action has steadily curved higher, forming a smooth rounded base. This gradual recovery — rather than a sharp V-shaped bounce — suggests healthier accumulation rather than short-term speculation.
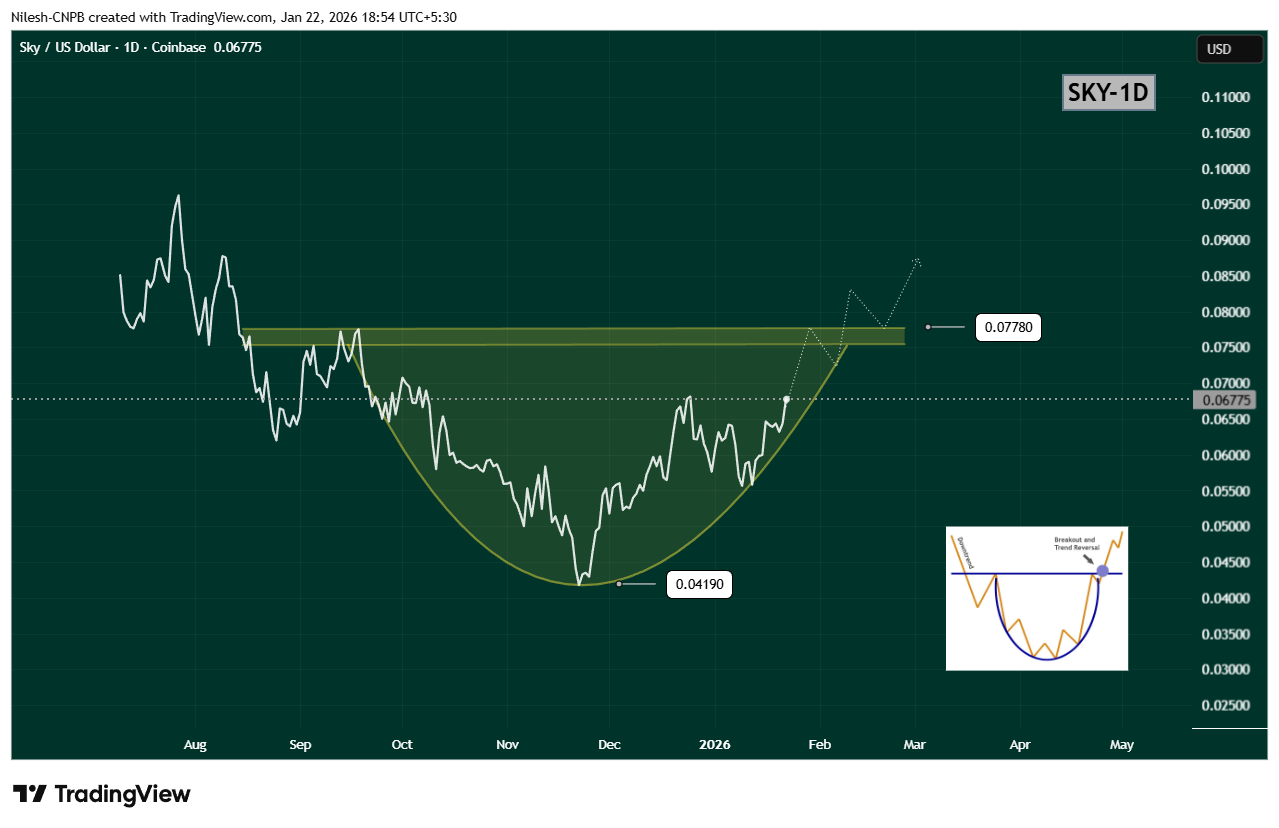
$SKY Daily Chart/Coinsprobe (Source: Tradingview)
Breakout Zone Comes Into Focus
Recent price action shows SKY reclaiming the $0.06933 region, a level that previously acted as resistance. This move strengthens the bullish structure and signals that buyers are gaining confidence ahead of a potential neckline test.
The key level to watch now is the $0.0778 resistance zone. A decisive daily close above this level would confirm the rounding bottom breakout and mark a clear shift in trend structure. Ideally, a breakout followed by a successful retest of this zone as support would further validate the bullish case.
Upside Projection and Risk Outlook
Based on the depth of the rounding bottom, the measured upside projection points toward the $0.11 region. Reaching this target would represent a potential 60–65% upside from current levels, aligning well with historical behavior of similar reversal patterns.
That said, patience remains important. Before any confirmed breakout, SKY could still experience short-term pullbacks or consolidation near the rising curve of the pattern. Such moves would not invalidate the bullish setup, as long as price continues to hold above recent higher lows.
A breakdown below the rounding base would weaken the structure, but for now, momentum favors the bulls.
Bottom Line
SKY is showing clear signs of a trend reversal in progress, with a rounding bottom pattern taking shape on the daily chart. Rising volume, improving structure, and a steady recovery toward neckline resistance all suggest that accumulation is underway.
If SKY can break and hold above $0.0778, the path opens toward the $0.11 region, signaling a broader bullish continuation. Until then, consolidation and minor pullbacks remain possible — but the overall structure is one that traders will be watching closely.
Disclaimer: The views and analysis presented in this article are for informational purposes only and reflect the author’s perspective, not financial advice. Technical patterns and indicators discussed are subject to market volatility and may or may not yield the anticipated results. Investors are advised to exercise caution, conduct independent research, and make decisions aligned with their individual risk tolerance.
About Author: Nilesh Hembade is the Founder and Lead Author of Coinsprobe, with over 5 years of experience in the cryptocurrency and blockchain industry. Since launching Coinsprobe in 2023, he has been providing daily, research-driven insights through in-depth market analysis, on-chain data, and technical research.
Disclaimer: The information on this page may come from third parties and does not represent the views or opinions of Gate. The content displayed on this page is for reference only and does not constitute any financial, investment, or legal advice. Gate does not guarantee the accuracy or completeness of the information and shall not be liable for any losses arising from the use of this information. Virtual asset investments carry high risks and are subject to significant price volatility. You may lose all of your invested principal. Please fully understand the relevant risks and make prudent decisions based on your own financial situation and risk tolerance. For details, please refer to
Disclaimer.
Related Articles
Bitcoin dips back below $75,000 on the eve of the Federal Reserve decision
Bitcoin recently touched $75,000 but failed to sustain the level, pulling back to $74,000, reflecting cautious sentiment among investors ahead of the upcoming Federal Reserve interest rate decision. Geopolitical risks and elevated energy prices have driven inflation higher, affecting market expectations for rate cuts and pushing the timeline for cuts to year-end. Technical analysis shows Bitcoin remains strong but has not confirmed a decisive breakout above the $75,000 level, with limited upside potential in the near term.
区块客18m ago
US Treasury yields rose to 4.41%, stock market correction approaching, Bitcoin fell from 90,000 USD to 60,000 USD at one point
Bitcoin has experienced a sharp pullback, with traditional financial markets showing signs of following suit. Rising US Treasury yields are pushing up borrowing costs, leading to decreased risk appetite in the stock market. Bitcoin's price is currently oscillating between $65,000 and $75,000, with market concerns persisting over future volatility. Investors need to monitor the correlation between interest rates and risk assets.
GateNews27m ago
Gold Faces Largest Weekly Decline in 43 Years, Smart Money Pivots to Private Equity and Crypto Assets
Gold experienced its largest single-week decline since 1983 this week, with prices plummeting approximately $600. This decline was primarily driven by a liquidity crisis that forced institutional investors to liquidate positions, rather than weakening safe-haven demand. Capital flows are shifting toward private markets, emerging markets, and digital assets. While the long-term logic for gold has not completely collapsed, it's necessary to observe whether market structure stabilizes.
MarketWhisper38m ago
XRP Price Action Hovers at Critical Support - U.Today
XRP is at a critical support level, with signs of potential reversal indicated by bullish divergence in the RSI. Despite a recent downtrend, strong retail demand is driving accumulation, setting XRP apart in a challenging market.
UToday38m ago
Bitcoin ETF Ends Seven-Day Winning Streak, Bitcoin Price Pressure Returns
US Bitcoin spot ETFs have turned to outflows following seven consecutive trading days of net inflows, indicating a shift toward more conservative capital allocation. Bitcoin price briefly fell below $70,000, reflecting weakened market sentiment and capital flows. ETF outflows stem from market reassessment of the macro environment, as investors reduce risk appetite amid elevated interest rate expectations and geopolitical risks. $70,000 has become a near-term technical dividing line between bulls and bears, with technical indicators suggesting market confidence still needs to be restored.
区块客43m ago
Analysts: Bitcoin and Gold Diverge, Central Banks and Retail Investors' Savings Logic "Decouples"
Bitcoin and gold are expected to diverge in their 2026 trajectories due to differences in their buyer demographics: gold is primarily driven by central banks and significantly influenced by geopolitical factors, while Bitcoin is predominantly held by individuals, offering advantages in circumventing traditional financial constraints. Analysts are divided on performance over the next three years, with Lyn Alden bullish on Bitcoin, while Ray Dalio believes gold maintains the advantage.
MarketWhisper45m ago
