
Key Takeaways
-
Avalanche (AVAX) has dropped over 16% in the past week, reflecting broader market weakness.
-
The 4H chart shows a Bullish Shark harmonic pattern, often associated with trend reversals.
-
Price is currently hovering near the $11.88 support, a critical zone for pattern validation.
-
If support holds, AVAX could rebound toward $13.39, with a higher upside target near $14.94.
-
A breakdown below the current support would invalidate the bullish setup and extend downside risk.
The cryptocurrency market remains under notable selling pressure as the total crypto market capitalization slipped 1.79% over the past 24 hours. This broader pullback triggered heightened volatility across digital assets, leading to more than $807 million in liquidations, with long positions bearing the brunt of the losses.
This wave of downside pressure has spilled into major altcoins, including Avalanche (AVAX). The token is trading slightly in the red and has dropped over 16% in the past seven days. However, beyond the red candles, AVAX’s chart is beginning to reveal a technical structure that suggests downside momentum may be weakening — and a rebound could be forming.
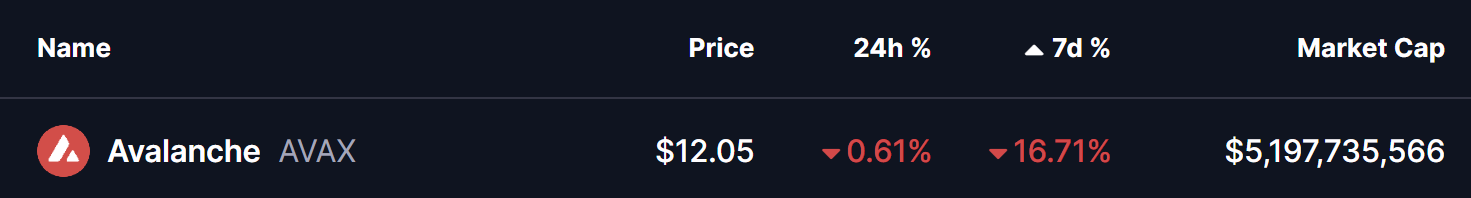
Source: Coinmarketcap
Harmonic Pattern Hints at Potential Upside
On the 4-hour timeframe, AVAX appears to be completing a Bullish Shark harmonic pattern, a formation that often emerges near market lows when selling pressure becomes exhausted. This pattern typically signals a potential trend reversal once its final leg forms within a defined demand zone.
The structure began with the initial O–X impulse around the $12.22 area, followed by a sharp rally that peaked near $14.83 at point X. Price then retraced aggressively toward point A before making another push higher to form point B near $14.94. That move, however, failed to sustain, triggering the current corrective leg.
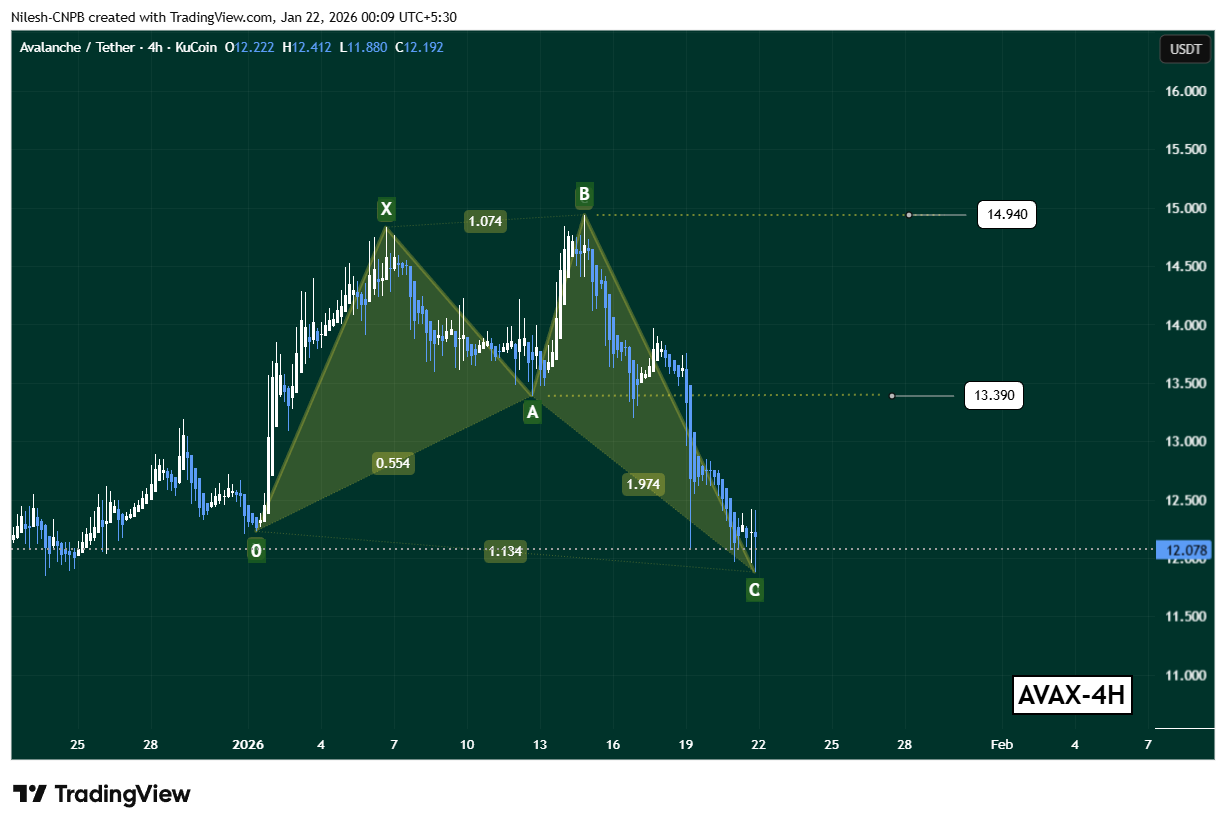
Avalanche (AVAX) 4H Chart/Coinsprobe (Source: Tradingview)
AVAX has since slid steadily lower, with price now hovering near $11.88, a level that could represent the C-point completion of the Shark pattern. This zone is technically important, as it’s where buyers often step in if the pattern is to play out bullishly.
What’s Next for AVAX?
If this harmonic structure continues to unfold as expected, AVAX could be positioning for a rebound from current levels. The first key upside level to watch sits around $13.39, which aligns closely with the prior A-point of the formation and serves as a near-term recovery target.
A stronger bullish follow-through could eventually bring the $14.94 region back into focus — the B-leg high and a significant resistance zone where sellers previously stepped in.
That said, the bullish outlook remains conditional. A sustained breakdown below the $11.88 support zone would invalidate the Shark pattern and shift momentum back in favor of the bears, opening the door for further downside continuation.
Bottom Line
AVAX may still be under pressure, but the emerging Bullish Shark harmonic pattern suggests selling momentum could be nearing exhaustion. As long as price holds above the current support zone, the setup favors a short-term rebound toward $13.39 and potentially $14.94. However, confirmation will depend on buyer response at current levels — making the next few sessions critical for Avalanche’s near-term direction.
Disclaimer: The views and analysis presented in this article are for informational purposes only and reflect the author’s perspective, not financial advice. Technical patterns and indicators discussed are subject to market volatility and may or may not yield the anticipated results. Investors are advised to exercise caution, conduct independent research, and make decisions aligned with their individual risk tolerance.
About Author: Nilesh Hembade is the Founder and Lead Author of Coinsprobe, with over 5 years of experience in the cryptocurrency and blockchain industry. Since launching Coinsprobe in 2023, he has been providing daily, research-driven insights through in-depth market analysis, on-chain data, and technical research.
Disclaimer: The information on this page may come from third parties and does not represent the views or opinions of Gate. The content displayed on this page is for reference only and does not constitute any financial, investment, or legal advice. Gate does not guarantee the accuracy or completeness of the information and shall not be liable for any losses arising from the use of this information. Virtual asset investments carry high risks and are subject to significant price volatility. You may lose all of your invested principal. Please fully understand the relevant risks and make prudent decisions based on your own financial situation and risk tolerance. For details, please refer to
Disclaimer.
Related Articles
Bittensor Holds Strength but Faces Resistance Near $285 Level
Key Insights:
Bittensor maintains strong short-term momentum above key averages, while ETF developments and high staking levels continue shaping liquidity and investor demand dynamics.
Overbought technical indicators signal stretched conditions, even as bullish momentum persists,
CryptoFrontNews9m ago
Dogecoin Slides Despite Elon Musk Reviving DogeFather Persona
Key Insights
Elon Musk’s DogeFather post sparked attention, yet Dogecoin’s price declined, showing limited market reaction despite strong social media engagement and renewed community discussion.
Dogecoin traded near $0.093 after a failed recovery attempt, with steady volume and moderate
CryptoFrontNews13m ago
Trump Issues 48-Hour Ultimatum to Iran, Bitcoin Drops Below 69,200 on Weekend
On March 22, following Trump's ultimatum to Iran, Bitcoin fell below $69,200, declining 2.2% over 24 hours. Market sentiment impacted mainstream crypto assets broadly, with declines across the board despite the Federal Reserve maintaining interest rates unchanged. War risk has made traders cautious. If Iran fails to restore Strait of Hormuz passage, the conflict could escalate, impacting global energy transportation.
GateNews39m ago
How High Can Ripple’s XRP Price Go This Week?
XRP's price is down due to a market-wide decline, particularly influenced by Bitcoin's pullback. Currently, XRP faces resistance around $1.45, with sideways movement indicating market uncertainty. The next price movement may rely on Bitcoin's stability.
CaptainAltcoin1h ago
Bitcoin dips back below $75,000 on the eve of the Federal Reserve decision
Bitcoin recently touched $75,000 but failed to sustain the level, pulling back to $74,000, reflecting cautious sentiment among investors ahead of the upcoming Federal Reserve interest rate decision. Geopolitical risks and elevated energy prices have driven inflation higher, affecting market expectations for rate cuts and pushing the timeline for cuts to year-end. Technical analysis shows Bitcoin remains strong but has not confirmed a decisive breakout above the $75,000 level, with limited upside potential in the near term.
区块客2h ago
19.78% Surge for LRC: What It Means for Investors
LRC surged 19.78% amid market selling, now trading at $0.02986 with a daily volume of over $3 million. Whale activity and altcoin rotation drive interest, as traders monitor key resistance and support levels for future movements.
Coinfomania2h ago
