Stable (STABLE) is one of the few green spots in a red market. The STABLE price is up over 12% today, trading near $0.0257, with volume up more than 55%. It is the top gainer at writing, even as the broader crypto market slides.
This move is not random. Price strength has been building for weeks, and today’s push brings several pieces together.
Over the past day, the STABLE price gained around 12.6% while the total crypto market fell more than 4%. Fear remains high across crypto, but STABLE has gone its own way.
When a token rises during a market-wide drop, it often points to demand focused on that asset alone. Traders tend to rotate into names showing strength when risk appetite is low, and STABLE fits that pattern right now.
This move also extends a larger run. STABLE is up more than 26% over the past week and over 41% across the last month.
Furthermore, from a price perspective, the STABLE price has stayed above its short-term trend levels. Price continues to trade above the 7-day SMA near $0.0238 and the EMA around $0.0236. These levels have acted as a base during pullbacks.
The recent reclaim of the $0.025 area turned former resistance into support. As long as price holds above the $0.0238 zone, the current trend remains intact. A daily close below that area would weaken the setup.
_****Pi Coin Faces Heavy February Unlocks – Here’s What Could Happen to Price**
- Here’s What The Stable Chart Is Showing
- Network Update Adds to the Narrative
- What to Watch Next For Stable
Here’s What The Stable Chart Is Showing
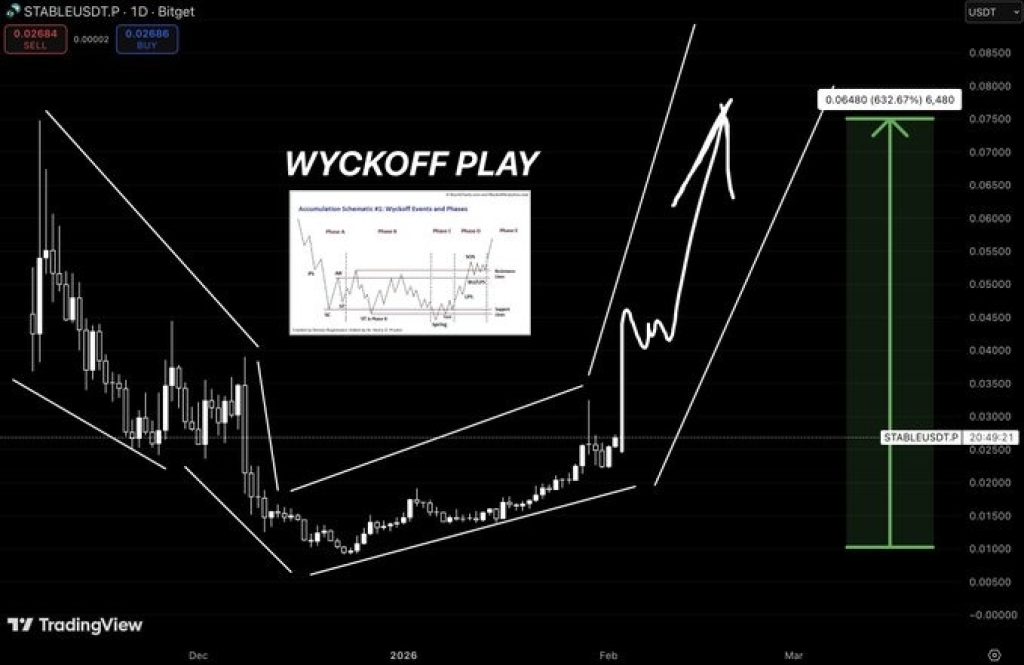
Traders are also focused on the structure visible on the chart. After weeks of steady decline,the STABLE price spent time moving sideways near the lows. Price then pushed higher and broke out, forming a rising channel.
This type of setup often appears after extended selling, when larger players finish building positions. The recent breakout from that base is why attention has picked up quickly.
As long as price stays inside the rising channel, the short-term bias remains to the upside. A failure back below the lower boundary would be the first sign of trouble.
_Source: _****X/Flippix
Network Update Adds to the Narrative
Alongside the technical setup, StableChain announced an upcoming mainnet upgrade. The network plans to adopt USDT0 as the native gas token, aiming to reduce swings in transaction costs and improve settlement reliability.
This change is designed to make fees more predictable, especially for real-world settlement use cases. While this update does not explain today’s move on its own, it adds context for why interest is building around the project.
_****Here’s How High Hedera (HBAR) Price Can Go This Week**
What to Watch Next For Stable
The immediate focus is on whether the STABLE price can hold above the $0.025 area. Holding this level keeps the breakout structure intact. A push toward the $0.03 zone would be the next test if volume stays elevated.
On the downside, losing $0.0238 would place the trend at risk and could bring a pause after the sharp run.
For now, STABLE stands out because price strength, volume, and structure are aligned. In a weak market, that combination tends to draw attention fast.
Disclaimer: The information on this page may come from third parties and does not represent the views or opinions of Gate. The content displayed on this page is for reference only and does not constitute any financial, investment, or legal advice. Gate does not guarantee the accuracy or completeness of the information and shall not be liable for any losses arising from the use of this information. Virtual asset investments carry high risks and are subject to significant price volatility. You may lose all of your invested principal. Please fully understand the relevant risks and make prudent decisions based on your own financial situation and risk tolerance. For details, please refer to
Disclaimer.
Related Articles
Analyst: If Bitcoin falls below the $66,000 support level, it may trigger a 10%-20% correction
Gate News reported that on March 20, Chartered Market Technician (CMT) Aksel Kibar stated on March 21 that the lower support boundary of Bitcoin's potential rising wedge formation is located at 66,000, and a breakdown below this level could trigger a bearish reversal. Aksel Kibar pointed out that rising wedges, as a classic technical pattern, typically appear at the end of uptrends, signaling price momentum exhaustion. Historical data shows that after similar downside breakdowns are confirmed, the average pullback ranges from 10%-20%.
GateNews47m ago
Bitcoin Slips Below $70,000 as Fed Rate Pause and Oil Surge Pressure Markets
Bitcoin declined to $70,000 due to steady interest rates from the Federal Reserve and rising energy prices, leading to $600 million in liquidations and increased market volatility, particularly affecting altcoins.
CryptoBreaking1h ago
XRP Climbs 3% Past $1.47 as Breakout Extends on Bitcoin-Led Rally
Key Takeaways
XRP broke above $1.426 resistance after months of consolidation, jumping to $1.47 on surging volume
Trading volume spiked over 250% during the move, indicating strong participation in the breakout
Activity on the XRP Ledger continues climbing, with tokenized real-world assets
CryptoBreaking1h ago
BTC down 0.65% in 15 minutes: Large spot selling orders dominate short-term pullback, panic sentiment intensifies volatility amplification
2026-03-20 13:45 to 2026-03-20 14:00 (UTC), BTC declined 0.65% within 15 minutes, with price range fluctuating between 69795.3 to 70399.4 USDT, reaching an amplitude of 0.86%. Market volatility intensified in the short term, trading activity increased, and investor attention rose.
The main driver of this price movement was concentrated large-scale active selling in the spot market. During this period, major trading platforms saw multiple large sell orders exceeding 100 BTC each, with sell orders accounting for 52% of volume, directly driving prices downward.
GateNews2h ago
