Bitcoin halving cycle is not over! Kaiko Research: Perfectly reproduces the 2018 bear market script

Kaiko Research reports show that Bitcoin’s 52% decline from $126,000 to $60,000 perfectly aligns with the bear market pattern following halving. After the April 2024 halving, peak values are typically reached within 12-18 months, open interest in futures has decreased by 55%, and ETF outflows have exceeded $2.1 billion. Kaiko warns that bear markets usually last 6-12 months.
52% Decline Perfectly Validates Bitcoin Halving Cycle Model
(Source: Kaiko)
Kaiko Research’s latest report indicates that Bitcoin’s recent price adjustments are reinforcing rather than weakening the long-standing four-year halving cycle that shapes the asset’s market behavior. This debate is highly significant for traders and investors anticipating Bitcoin’s price volatility in early 2026. Bitcoin’s price has fallen from nearly $126,000 at the cycle peak to the $60,000–$70,000 range in early February, a decline of about 52%.
Although this movement has shaken market sentiment, Kaiko believes that this drop is entirely consistent with previous Bitcoin bear markets following halving events and does not indicate a structural change in historical patterns. Kaiko’s data briefing states: “Bitcoin’s fall from $126,000 to $60,000 confirms the four-year halving cycle, rather than contradicting it. After reaching a peak, this cycle typically experiences a 50-80% retracement.”
The report notes that the 2024 Bitcoin halving occurs in April. Prices tend to peak approximately 12 to 18 months afterward, aligning with previous cycles. Historically, such peaks are often followed by a bear market lasting about a year before the next accumulation phase begins. Kaiko suggests that current price trends indicate Bitcoin has exited the frenzy phase post-halving and entered the expected correction period.
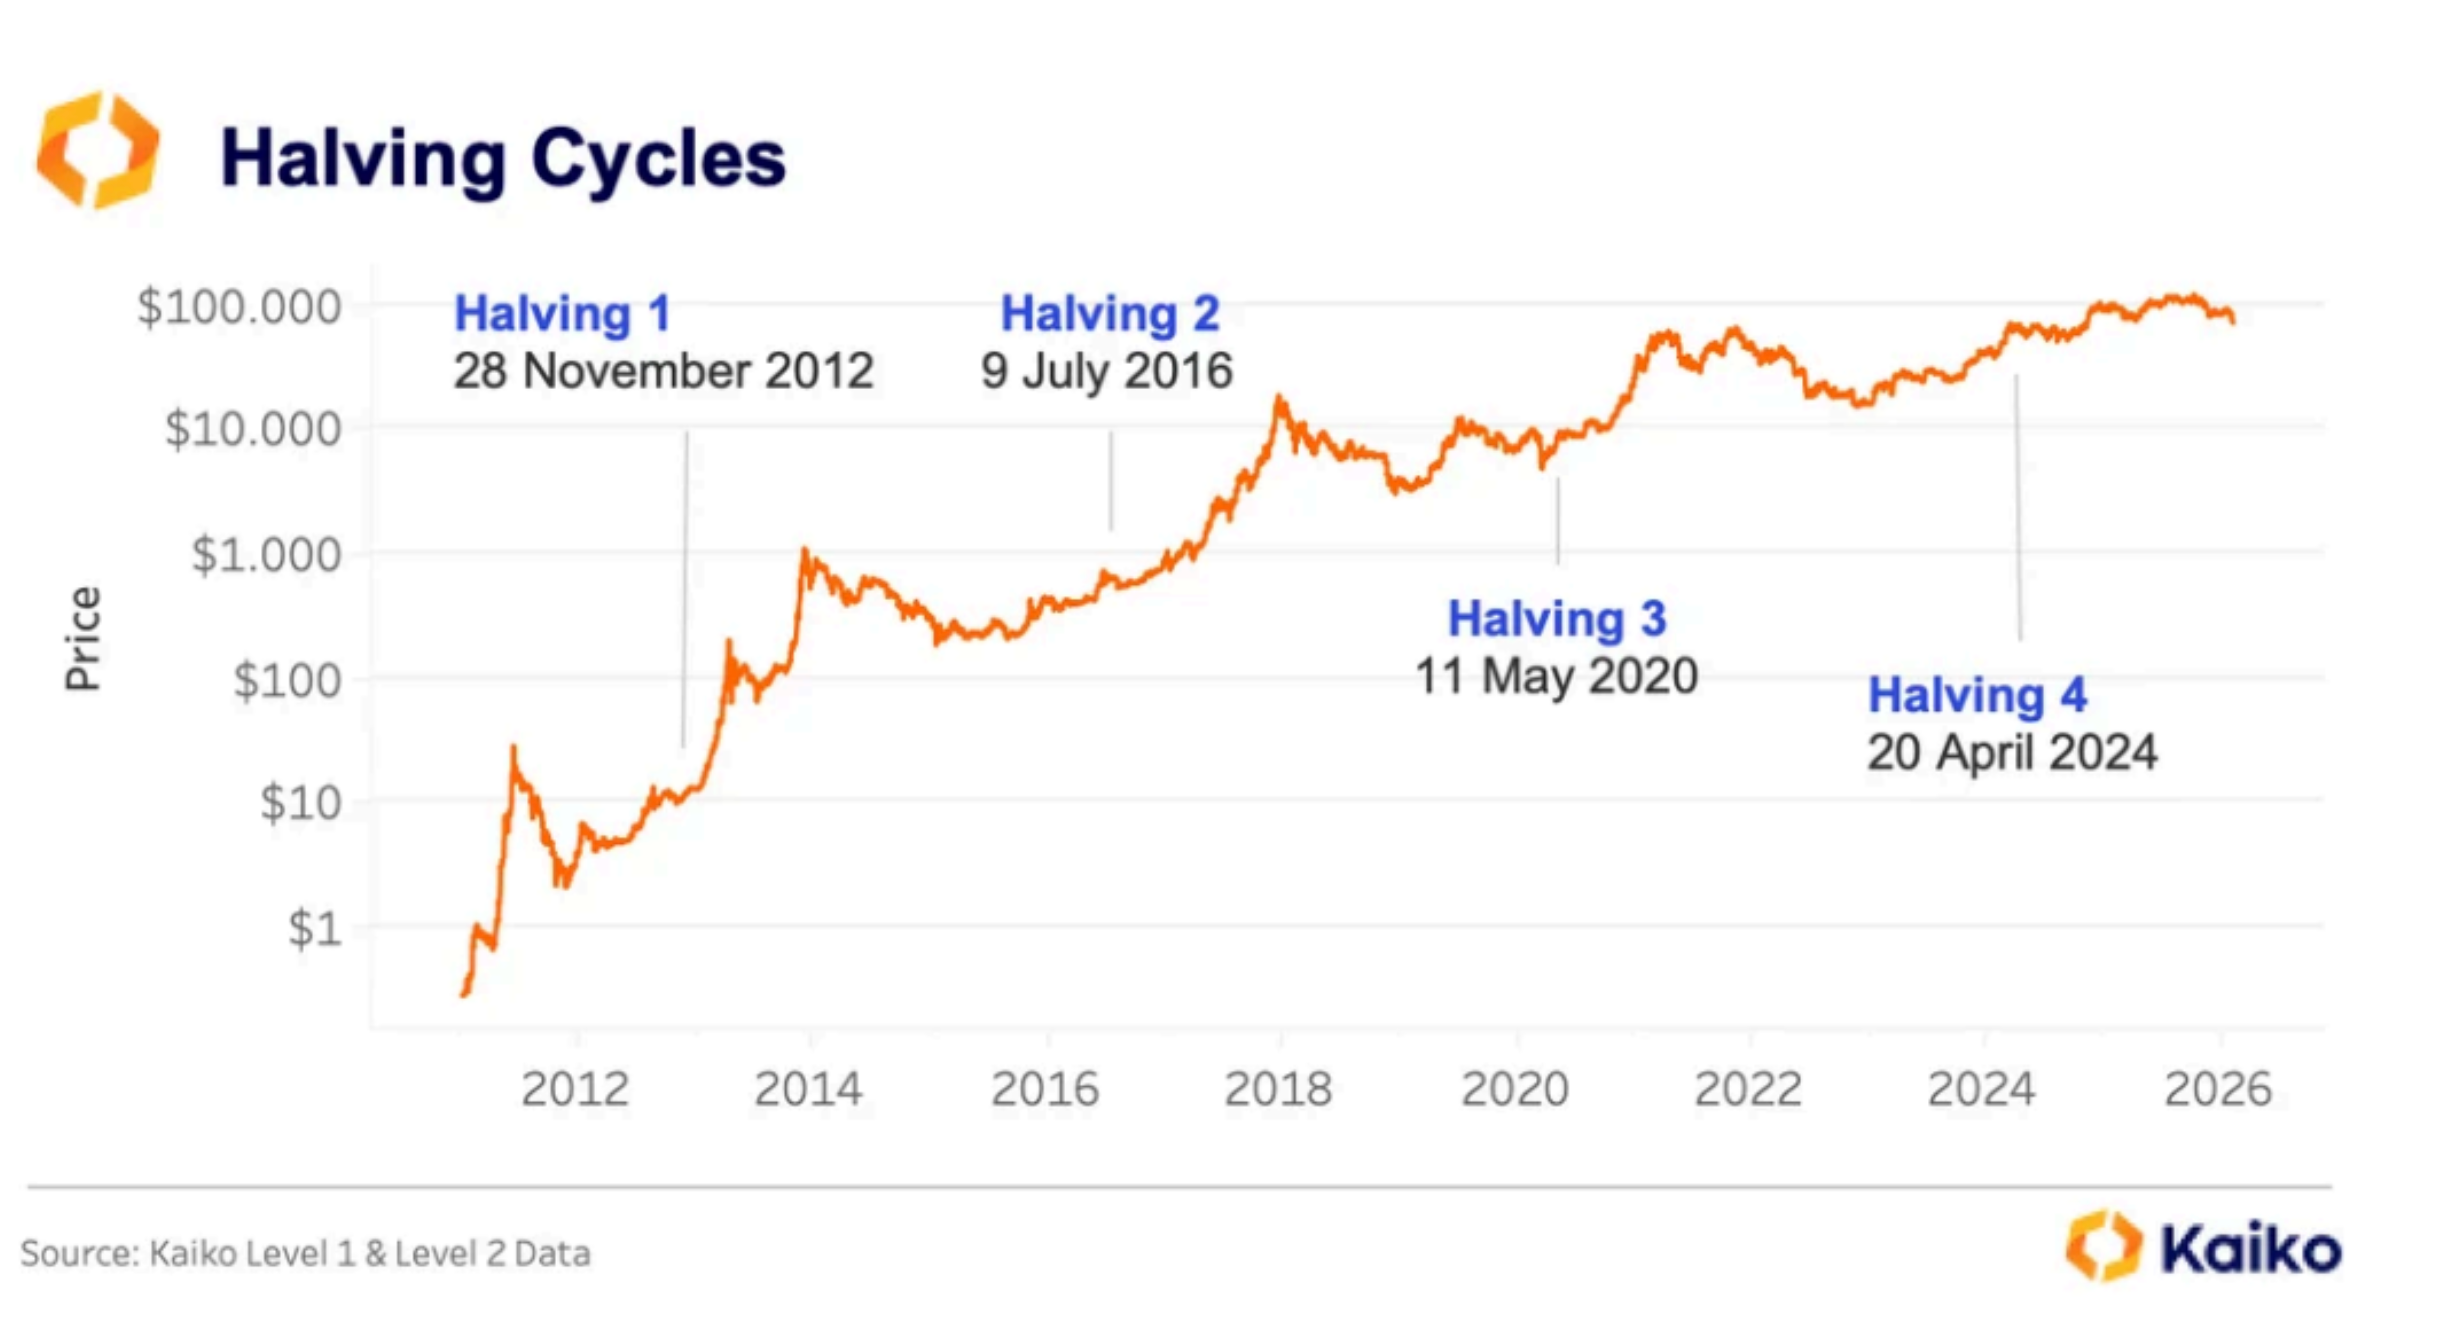
Historical data shows that after the 2012 halving, Bitcoin reached a peak of $1,100 in 2013 before crashing 87% to $150. After the 2016 halving, Bitcoin hit a peak of $19,700 in December 2017, then fell 84% to $3,200. Following the 2020 halving, Bitcoin reached a high of $69,000 in November 2021 before dropping 77% to $15,500. The current 52% decline, while sharp, remains within the lower bounds of historical retracements, suggesting there may still be further downside.
Historical Halving Cycles Comparison
2012 Halving: Peak followed by an 87% decline, bear market lasted about 14 months
2016 Halving: Peak followed by an 84% decline, bear market lasted about 12 months
2020 Halving: Peak followed by a 77% decline, bear market lasted about 11 months
2024 Halving: Peak followed by a 52% decline so far, bear market ongoing
This highly consistent pattern is not coincidental but stems from the economic logic of Bitcoin’s halving mechanism. Each halving reduces miners’ Bitcoin rewards by 50%, slowing supply growth and, in the medium to long term, driving prices higher. However, post-halving price increases often attract excessive speculation and leverage, eventually leading to bubbles and bear markets. This cyclical pattern has repeated three times, and the current cycle is the fourth, following the same law.
Has Arthur Hayes’ Liquidity Theory Been Disproved?
It is worth noting that many experts previously questioned the four-year cycle of Bitcoin halving. In October last year, BitMEX founder Arthur Hayes stated that the four-year cycle had ended. He argued that global liquidity, rather than halving events, is the primary driver of price movements. Hayes’ reasoning was based on correlations between macro liquidity indicators—such as the Federal Reserve’s balance sheet and global M2 money supply—and Bitcoin prices.
Others believe that Bitcoin’s current cycle is five years rather than four. They cite increasing influence from global liquidity conditions, institutional participation, and broader macroeconomic policy shifts. This view suggests that as Bitcoin’s market size expands and institutional involvement grows, the supply shock effect of halving is diluted, and macro factors become more dominant.
However, current price movements seem to support Kaiko’s traditional four-year cycle theory more strongly. The 52% decline, the 12-18 month peak timeframe, and the market de-leveraging features all align closely with historical halving cycles. This does not mean liquidity is unimportant but indicates that halving cycles and liquidity cycles may resonate with each other. Bitcoin halving often occurs during specific phases of the global liquidity environment, and their combined effects amplify price volatility.
Kaiko acknowledges that structural changes—such as the proliferation of spot Bitcoin ETFs, clearer regulation, and the maturing DeFi ecosystem—make the 2024–2025 cycle different from previous ones. Nonetheless, these developments have not prevented the anticipated post-peak correction. Instead, they have altered the way volatility manifests. During recent sell-offs, spot Bitcoin ETFs experienced over $2.1 billion in outflows, intensifying downward pressure and showing that institutional access can both increase and decrease liquidity.
Where Is the Bottom? Historical Warnings from 6-12 Month Bear Markets
Kaiko raises a key question dominating current market discussions: where is the bottom? The report explains that Bitcoin’s intraday rebound from $60,000 to $70,000 suggests initial support levels may be forming. However, historical precedent indicates that Bitcoin bear markets following halving events typically last 6 to 12 months, with multiple failed rallies before establishing a sustainable bottom.
This timeframe has important implications for investment decisions. If Bitcoin peaks at $126,000 in October 2025, historical patterns suggest the bear market could last until April to October 2026. This means the current phase is likely early or mid-stage of the bear, with the true bottom possibly not arriving until mid- or late-year. During this period, investors might see several rebounds to $80,000 or even $90,000, but these rallies are likely to fail, and prices will dip again.
Kaiko notes that the stablecoin market share is currently at 10.3%, funding rates are near zero, and futures open interest has decreased by about 55%, indicating significant deleveraging. Deleveraging is a typical feature of bear markets, reflecting that speculators are exiting, and the market is returning to rationality after mania. However, deleveraging is a process, not a single event, often taking months to complete.
According to Kaiko: “Although DeFi infrastructure has shown relative resilience compared to 2022, declines in TVL and slowing staking flows indicate no sector is immune to bear market effects. Insufficient regulation prevents cryptocurrencies from decoupling from broader macro risks, with Fed uncertainty and risk asset weakness dominating the market.”
Kaiko also cautiously states that it remains difficult to determine whether current conditions represent early, mid, or late stages of capitulation. “The four-year cycle framework predicts we should reach about 30%. Bitcoin’s behavior is identical to previous cycles, but many market participants believe this time will be different,” Kaiko writes. As February 2026 approaches, market participants must weigh both sides of this argument. The next move of Bitcoin will reveal whether history repeats or a new market regime is forming.
Related Articles
Avalon Labs officially launches the SuperEarn financial management section
A certain whale deposited 8.58 million USDC into Lighter and yesterday opened a 20x leveraged long position in BTC.
A whale deposited 1,765,000 USDC into HyperLiquid to open long positions on ETH and BTC.
The UAE has accumulated $450 million worth of Bitcoin through mining, with a net profit of $344 million after deducting costs.
Harvard Buys $87M in Ethereum ETF, Cuts Bitcoin Stake
Yesterday, US Bitcoin spot ETFs experienced net outflows of $133 million, while Ethereum ETFs saw net outflows of $41.8 million.