
ONDO has quietly stayed on traders’ radars even through a pretty rough stretch for altcoins. After months of selling pressure, the price is finally starting to calm down near a major support area, and the chart is beginning to look a lot more interesting again.
The ONDO price hasn’t gone on a serious run yet, but the structure is tightening up in a way that usually comes right before a bigger move.
- The ONDO Price Is Getting Squeezed Inside a Falling Wedge
- Resistance Is the Wall ONDO Has to Break
- ONDO Price Outlook From Here
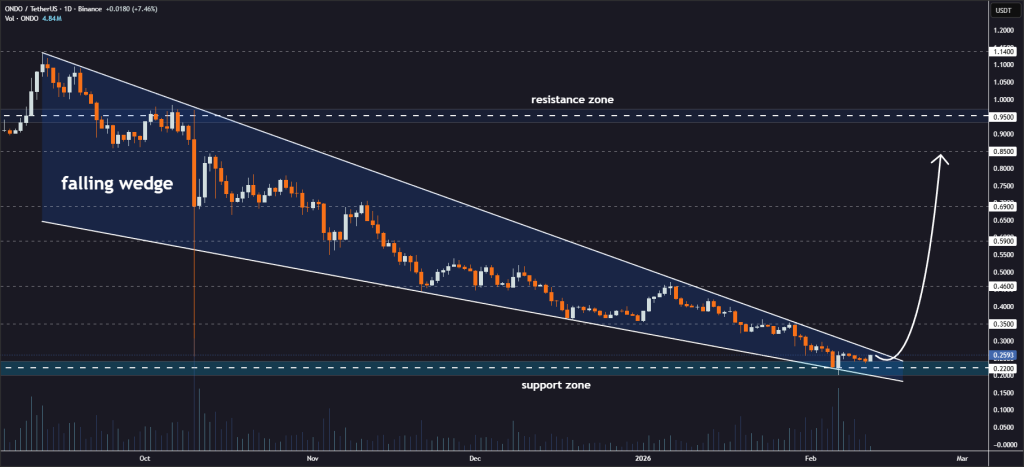
The ONDO Price Is Getting Squeezed Inside a Falling Wedge
On the daily chart shared by Jonathan Carter, the ONDO price has been trading inside a falling wedge for quite a while now. This pattern shows up when price keeps pushing lower, but each move down gets smaller and smaller.
That’s exactly what’s happening here. Sellers have been in control, but they’re losing momentum, and the range is compressing into a tighter channel. Now ONDO is pressing up against the upper edge of that wedge, which is usually the point where things start to heat up.
Source: X/@JohncyCrypto
These setups don’t stay quiet forever, once price runs out of space, volatility tends to come back fast. Support has also been holding strong around the $0.22–$0.25 zone, and buyers keep stepping in there.
Resistance Is the Wall ONDO Has to Break
The big level to watch now is wedge resistance just under $0.30. The ONDO price has been grinding right below it, and this is basically the make-or-break area. If bulls can finally push through, the chart opens up quickly.
The first upside levels traders are eyeing sit around $0.35 and $0.46, which match previous reaction zones. And if momentum really comes back, the bigger targets in the setup stretch toward $0.59, $0.69, and even $0.85.
Of course, nothing is guaranteed. If the ONDO price fails to break out and gets slapped back down, support becomes the key level all over again.
That $0.22 floor is doing a lot of heavy lifting right now. If it breaks, the wedge setup falls apart, and price could slide into another weak leg lower. That’s why this zone matters so much, ONDO is sitting right at a turning point.
Here’s the (Ondo) ONDO Price If Tokenized Stocks Just Become DeFi’s Next Big Collateral Boom_**
ONDO Price Outlook From Here
At the moment, the ONDO price is stuck in a classic squeeze. Support is holding, resistance is tightening, and the wedge is almost complete. That combination usually leads to a sharp move once the market finally chooses a direction.
If ONDO breaks above the wedge, upside targets show up fast. If it doesn’t, traders will be watching support closely for the next reset. Either way, ONDO isn’t drifting anymore, it’s setting up for a real decision move.
Disclaimer: The information on this page may come from third parties and does not represent the views or opinions of Gate. The content displayed on this page is for reference only and does not constitute any financial, investment, or legal advice. Gate does not guarantee the accuracy or completeness of the information and shall not be liable for any losses arising from the use of this information. Virtual asset investments carry high risks and are subject to significant price volatility. You may lose all of your invested principal. Please fully understand the relevant risks and make prudent decisions based on your own financial situation and risk tolerance. For details, please refer to
Disclaimer.
Related Articles
'Black Swan' Author Nassim Taleb Believes Elon Musk's X Money is 'Much Smarter' Than Bitcoin - U.Today
Elon Musk's X Money will enter early access in April, with Nassim Taleb praising it as a superior alternative to Bitcoin. He argues it promotes competition in currency issuance, functional daily use, and is backed by a robust infrastructure, unlike volatile cryptocurrencies.
UToday43m ago
ETH 15-minute decline of 0.80%: On-chain large fund flows and DEX selling pressure resonate to trigger a downtrend
2026-03-11 15:00 to 2026-03-11 15:15 (UTC), ETH price briefly and rapidly declined within the range of 2042.35 to 2065.57 USDT, with a K-line return of -0.80% and an amplitude of 1.13%. Market volatility intensified during this period, with significantly increased attention, and short-term market pressure triggered market alertness.
The main driving force behind this anomaly is large-scale on-chain fund flows and sell pressure concentrated on decentralized exchanges (DEX). Monitoring data shows multiple large ETH transfers to trading platforms, suspected to involve institutions or whales.
GateNews1h ago
XRP Price Hints at Bullish Reversal as Negative Funding Rates Build Pressure on Short Sellers
XRP shows potential for a bullish reversal as market indicators align, with negative funding rates possibly triggering a short squeeze. Technical patterns and whale accumulation further support an upward move, indicating a significant price change may be imminent.
CryptometerIo1h ago
Shiba Inu (SHIB) regains momentum as buying pressure reaches the highest level of the month
The price of Shiba Inu (SHIB) is fluctuating around the 0.0000056 USD mark at the time of writing on Wednesday, after rising nearly 7% over the past two days. This recovery trend appears as on-chain indicators and derivatives market data begin to send positive signals. Trading volume is increasing.
TapChiBitcoin2h ago
Goldman Sachs: Hedge fund positioning may create conditions for a rebound in US stocks, with short positions rising to the highest since September 2022
Goldman Sachs report indicates that the structure of hedge fund positions in the US stock market is creating conditions for a market rebound. Speculators maintain long positions while shorting ETFs and futures. Short positions have reached their highest level since September 2022, reflecting market responses to uncertainty. If positive news emerges, it could trigger a rapid market rally.
GateNews2h ago
ETH 15-minute increase of 0.83%: Whales' capital inflow and DeFi lending demand resonate to drive the price
Between 13:30 and 13:45 (UTC) on March 11, 2026, ETH experienced a short-term fluctuation. The candlestick data shows a return of +0.83%, with a price range of 2046.07 to 2082.31 USDT, and an amplitude of 1.77%. Market activity increased during this period, with trading volume significantly higher than the previous cycle, and volatility exceeding the intraday average, attracting widespread market attention.
The main drivers of this fluctuation were the rapid inflow of large on-chain funds and active institutional accounts. Between 13:32 and 13:43,
GateNews2h ago