
Kaspa (KAS) is moving through a rough market phase, but development on the network continues in the background.
A major hardfork is scheduled for May, introducing smart contracts and native assets through a covenant-focused upgrade. The goal is to bring programmability directly to Layer 1.
Kaspa has now processed over 600 million transactions, showing that people are still using the network and that its BlockDAG system is handling activity well.
Even with that progress, the broader market drop in late February, driven by geopolitical tension, pulled most crypto prices down, including KAS. The KAS price was not spared and is now trading around $0.02985 after testing support.
- What the Kaspa Chart Is Showing
- What the Indicators Are Saying
- Kaspa Price Targets to Watch This Week
What the Kaspa Chart Is Showing
On the 4H chart, KAS remains in a broader downtrend. Price has been forming lower highs for weeks, and each bounce has struggled to gain momentum.
The recent correction took the Kaspa price down to the range of $0.024 to $0.025, but the token has since traded sideways in the range of $0.028 to $0.031. That range now defines the short-term battle zone.
Right now, KAS is trading just under $0.03. The market is no longer falling aggressively, but it also hasn’t broken structure. It looks more like stabilization after a drop rather than a confirmed reversal.
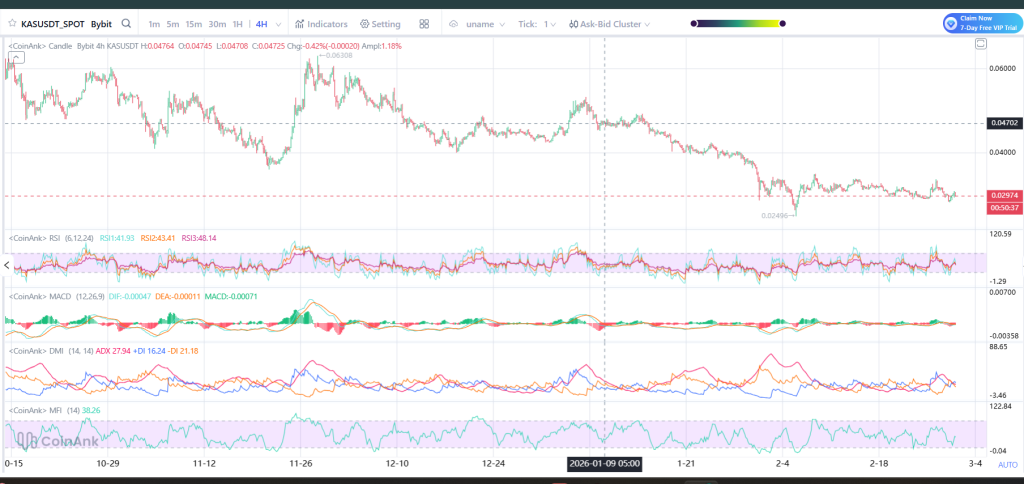
Source: Coinank
What the Indicators Are Saying
RSI is around the low 40s. That means the KAS price isn’t deeply oversold, but it’s not strong either. Buyers are not clearly in control.
MACD is flat with small bars, so there is no clear trend right now and no strong bullish signal.
DMI shows sellers slightly ahead, but not by much. The gap is small. MFI is also in the middle, which means money is flowing in and out evenly.
All of this points to one thing: the market is moving sideways, not making a big move yet.
_****Sei (SEI) Price at Historic Support as Experts Call It the “Final Gift”**
Kaspa Price Targets to Watch This Week
If KAS holds above $0.028, the next price to look at is $0.032. If it gets above $0.032, it can move toward $0.036–$0.038. After that, $0.047 is the next big level.
If the Kaspa price falls below $0.028, then $0.025 comes into view. If it drops under $0.025, the next area is around $0.022.
For now, KAS is trying to calm down after weeks of falling. The network news is positive, but the chart needs a move above $0.032 to look stronger. This week should show whether price starts climbing or tests lower levels again.
Disclaimer: The information on this page may come from third parties and does not represent the views or opinions of Gate. The content displayed on this page is for reference only and does not constitute any financial, investment, or legal advice. Gate does not guarantee the accuracy or completeness of the information and shall not be liable for any losses arising from the use of this information. Virtual asset investments carry high risks and are subject to significant price volatility. You may lose all of your invested principal. Please fully understand the relevant risks and make prudent decisions based on your own financial situation and risk tolerance. For details, please refer to
Disclaimer.
Related Articles
Crypto and Finance Experts Draw Attention to Business Cycle, Expect Explosive Crypto Price Action
Crypto and finance experts draw attention to business cycle.
Experts expect explosive crypto price action soon.
The price of BTC could dip further, but long-term looks highly bullish.
The current state of the crypto market seems to be heading towards a bullish setup. Over the last few m
CryptoNewsLand17m ago
BTC short-term decline of 0.76%: key price levels encountering resistance and long leverage liquidations triggering market sell-off
On March 5, 2026, from 14:30 to 14:45 (UTC), Bitcoin (BTC) experienced a short-term decline, with a return of -0.76%. The price ranged between 71,958.3 and 72,830.0 USDT, with an amplitude of 1.20%. Market attention significantly increased, and during the event window, trading volume expanded, volatility intensified, and price anomalies attracted many investors' focus on short-term risks and future trends.
The main driver of this anomaly was BTC encountering resistance in the key price zone of $73,750–$74,400. Historical data shows that this zone has repeatedly acted as a...
GateNews26m ago
Bitcoin: Real-Time Sentiment Gauge for Weekend Warmongering
The article analyzes Bitcoin's real-time sentiment as a gauge during weekend market fluctuations, emphasizing its role in reflecting broader economic trends and investor behavior in the crypto landscape.
CryptoBreaking28m ago
Ripple CTO Emeritus Shares Candid Truth about XRP and Crypto Market - U.Today
David Schwartz, former Ripple CTO, expressed mixed feelings about XRP's performance, reflecting broader crypto market sentiment. Despite recent struggles for altcoins, XRP showed signs of a potential recovery with a newly formed "golden cross" on its price chart, although market conditions remain cautious.
UToday53m ago
When the Asia-Pacific stock markets hit the circuit breaker, why does Bitcoin stand out as the best?
Author: Jae, PANews
On March 4th, as the situation in the Middle East suddenly worsened, global financial markets instantly entered a "wartime state." For global investors, this was a trading day worthy of being recorded in history.
Disruption of shipping through the Strait of Hormuz, a critical energy choke point, triggered a sharp surge in international oil prices. Panic quickly swept through traditional capital markets, and Asia-Pacific stock markets experienced an epic sell-off.
KOSPI in South Korea plummeted 12% in a single day, marking the largest decline in history; the Nikkei 225 dropped 3.7%, its worst performance in five months; Middle Eastern local stock markets once tumbled nearly 5% amid a correction; major European and American stock indices closed lower across the board.
However, an unusual phenomenon quietly emerged amid this sell-off.
The crypto market, often regarded as "high risk, high volatility," which tends to be the first asset class to collapse during any geopolitical crisis, surprisingly held steady this time.
Bitcoin experienced a brief panic
区块客1h ago
Here’s the Litecoin (LTC) Price If Investors Start Treating LTC as Crypto’s Digital Silver
The Litecoin price edged up a bit today. LTC is trading around $56.39, about 1.4% higher than yesterday. The move came as Bitcoin lifted the rest of the market.
The earlier decline slowed down around $55.33, and this is where buying emerged and halted the fall. Since then, it has been stuck ar
CaptainAltcoin1h ago

