U.S. President Donald Trump authorized the “Operation Epic Fury” to carry out the first airstrike against Iran in the early hours of February 28. Within four days, major asset classes exhibited significant divergence. Bitcoin increased by 12.1% since the outbreak of the U.S.-Iran war, surpassing oil, gold, and silver, and temporarily ranking at the top of the trillion-dollar asset list. Gold initially surged due to safe-haven demand but has fallen 3% since the war officially erupted.
Four Days After the U.S.-Iran War: Overview of Major Asset Performance Data
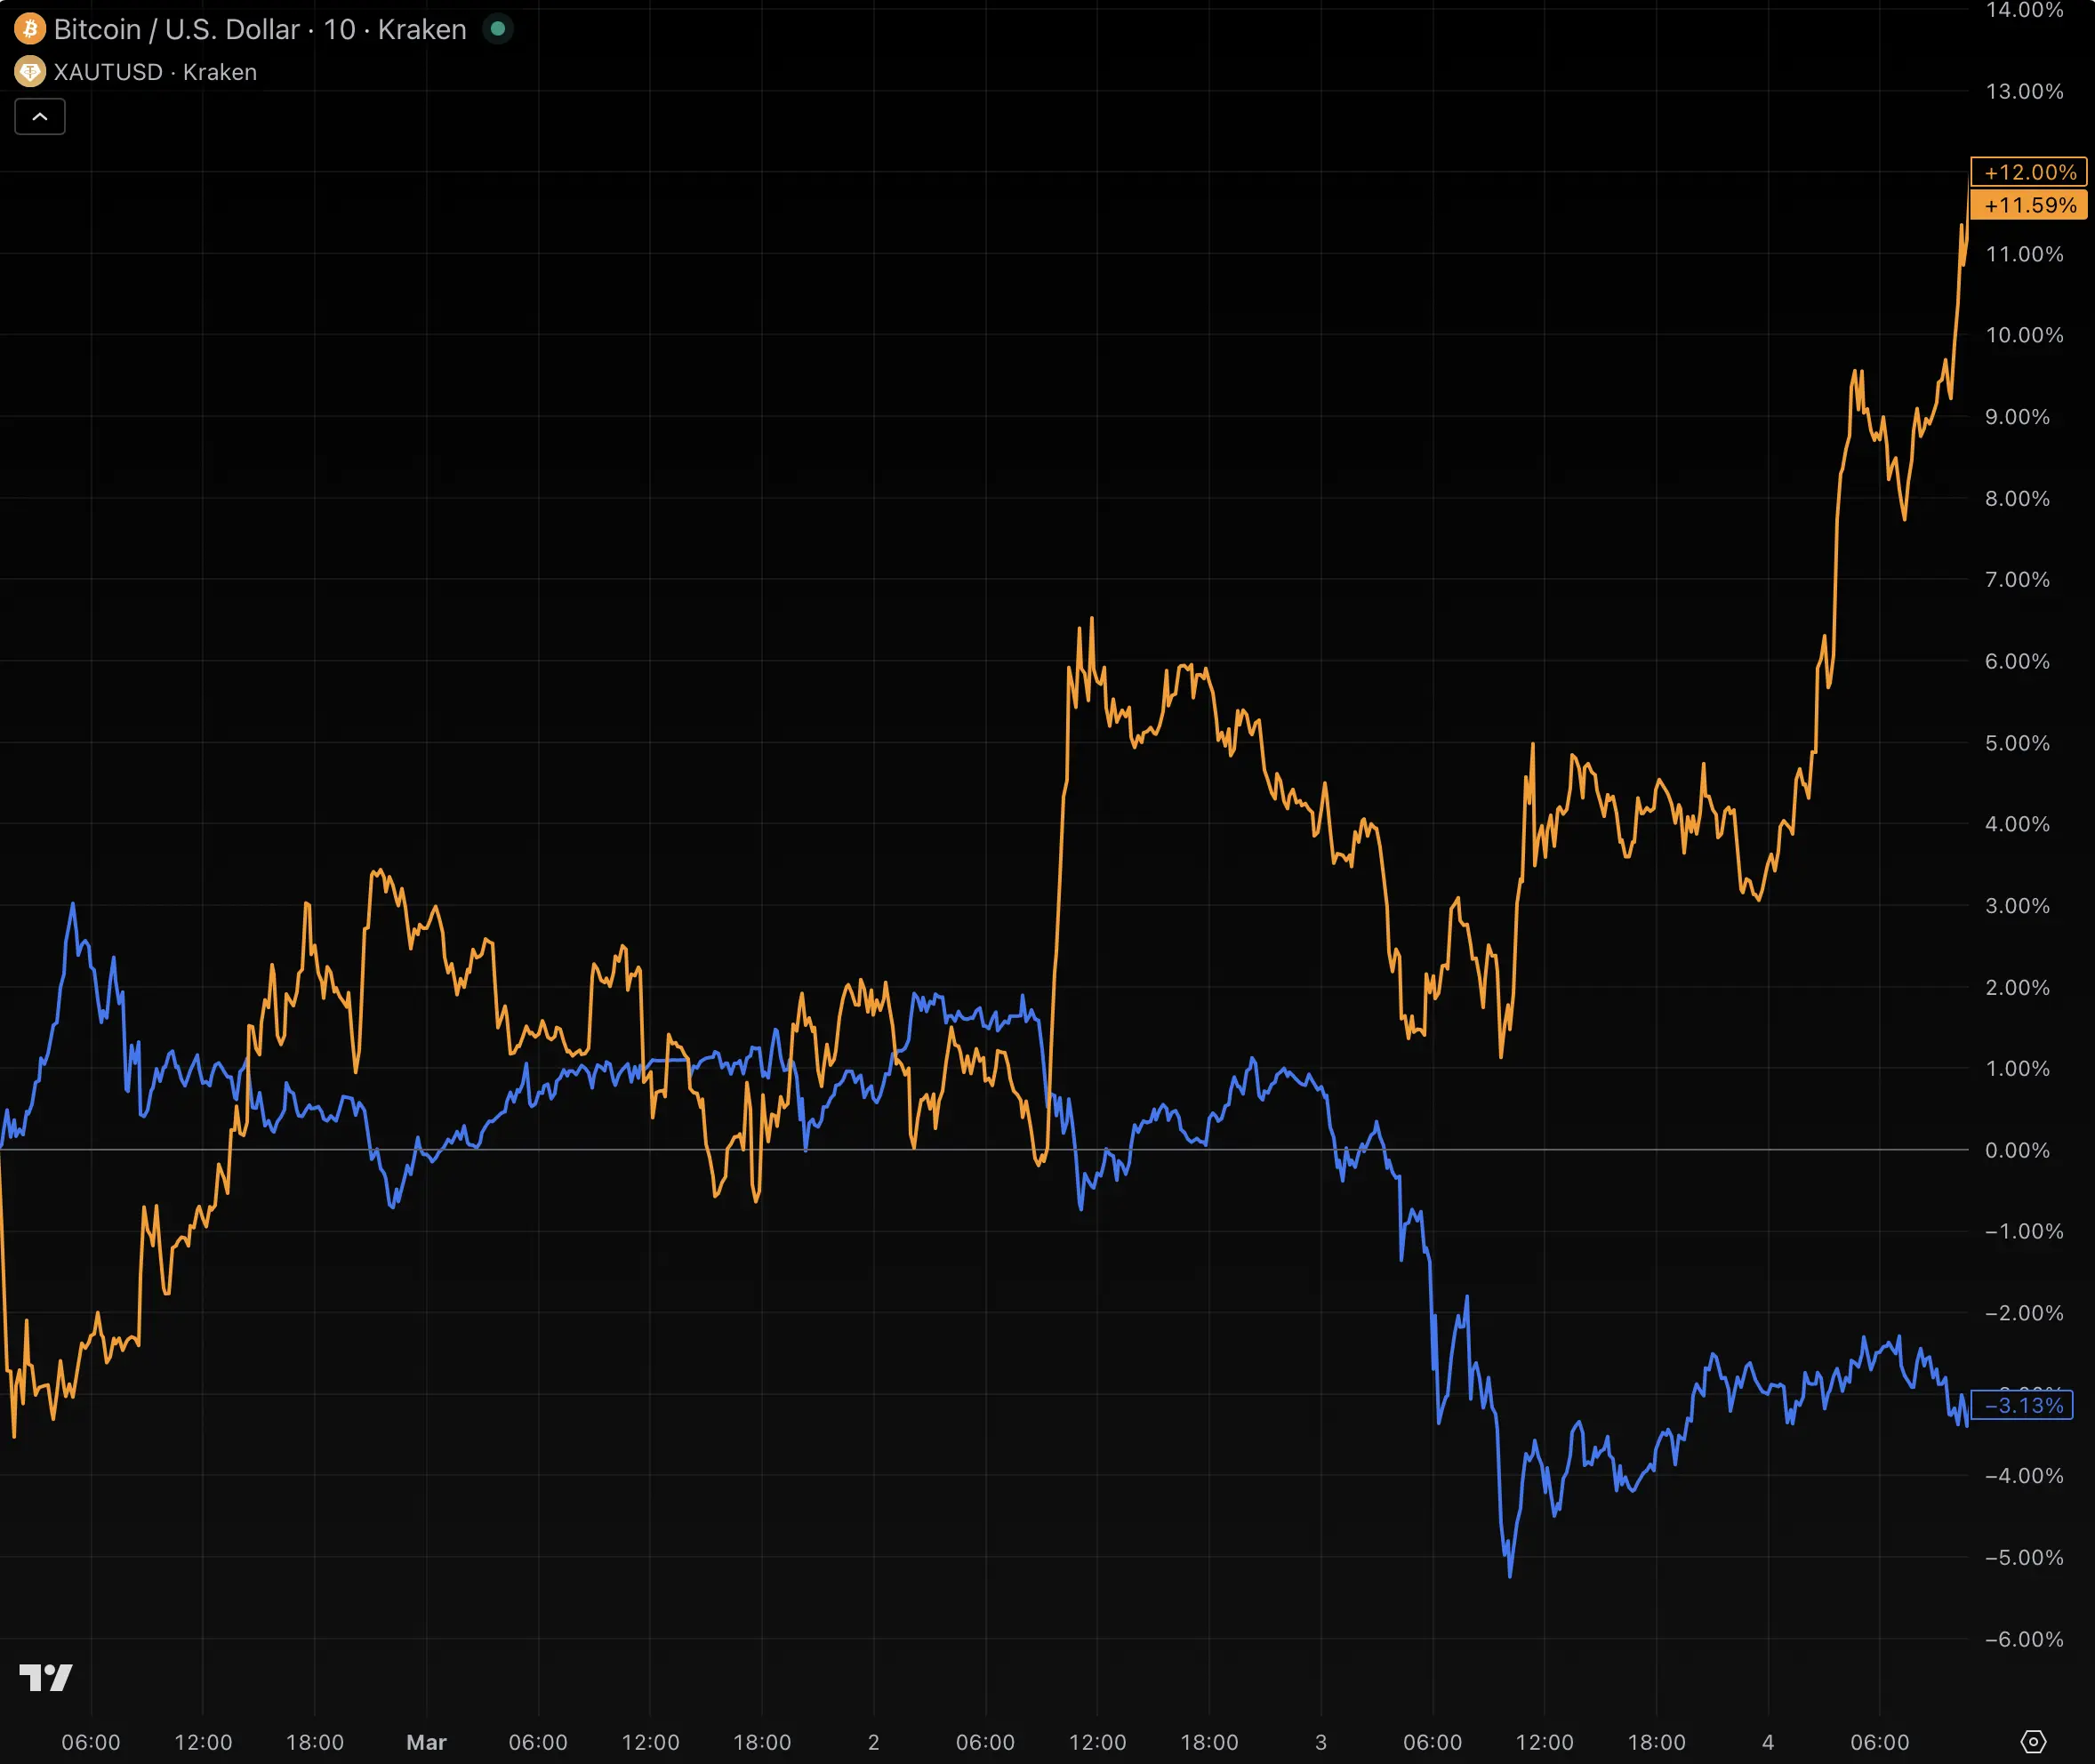 (Source: TradingView)
Based on the timing of Trump’s authorization for the first airstrike, the price changes of various assets within four days of the outbreak are as follows:
Bitcoin (BTC): +12.1%, from $65,492 to $73,419, the strongest performer among trillion-dollar assets
Brent Crude Oil: +10.4%, from $67.29 to $74.31 per barrel, supported by supply shortages
Nvidia: +2.8%, still lagging behind Bitcoin by 340 basis points when adjusted for market cap ratio (3.1 times)
S&P 500 Index: -0.1%, essentially flat
Gold: -3%, falling below pre-war levels after initial safe-haven buying subsided
Silver: -10.2%, surged initially but fully retraced, the largest decline among major assets
The performance of precious metals is particularly noteworthy. Before the war, as signs of U.S. military deployment to the Middle East emerged, gold and silver rose steadily following historical patterns; however, three days after the war officially started, a strengthening dollar and inflation expectations replaced geopolitical hedging needs, turning gold and silver downward, resulting in net losses for investors holding precious metals.
Strait of Hormuz Blockade: Structural Analysis of Oil Supply Shock
Although oil’s rise during this U.S.-Iran war aligns with supply logic, its overall performance still lagged behind Bitcoin. Iran’s Islamic Revolutionary Guard Corps threatened to block the Strait of Hormuz, a critical channel carrying about one-fifth of global oil shipments daily, prompting insurers to cancel large amounts of war risk policies, and shipping companies to reroute to avoid the area. Since the war’s outbreak, tanker traffic through the strait has decreased by approximately 81%, and freight rates have soared to historic highs.
Brent crude oil once surged 13% to $82 per barrel. Barclays analysts warned that if the blockade persists, oil prices could reach $100 per barrel. OPEC+ announced a daily increase of 206,000 barrels to ease supply pressures, but this measure has not fully alleviated market concerns over long-term supply disruptions.
AI Model Research: Bitcoin’s Role as a Currency in Machine Decision-Making
A study covering 36 cutting-edge AI models, with a total of 9,072 experiments, provides quantitative support for Bitcoin’s safe-haven properties. The study shows that in scenarios choosing the optimal currency asset, 48% of AI agents selected Bitcoin; in specific store-of-value scenarios, the proportion rose to 79%. Anthropic’s Claude Opus 4.5 selected Bitcoin in 91% of test scenarios, the highest among participating models.
It’s worth noting that the four-day performance data above contrasts sharply with the long-term data from the beginning of the year—Bitcoin has fallen 16%, while gold has risen 18%. The short-term war window and long-term asset allocation trends belong to different analytical frameworks and should be evaluated separately.
Frequently Asked Questions
Why did Bitcoin outperform gold after the outbreak of the U.S.-Iran war?
In this conflict, initial safe-haven buying of gold quickly dissipated after the war officially broke out, as a strong dollar and inflation expectations dominated capital flows. Bitcoin benefited from institutional demand for decentralized assets as a geopolitical hedge, showing stronger holding momentum within the same time window, and has temporarily topped the trillion-dollar asset rankings since Saturday.
What is the impact of the Strait of Hormuz blockade on the oil market?
The Strait of Hormuz carries about one-fifth of global oil shipments daily, with tanker traffic down approximately 81%. Barclays analysts warn that if the blockade continues, oil prices could reach $100 per barrel. Although OPEC+ announced a daily increase of 206,000 barrels, prolonged blockade may render this insufficient to fully offset the supply gap.
How should we interpret the AI models’ preference for Bitcoin?
The study, involving 36 advanced AI models and 9,072 experiments, reflects machine preferences for the optimal currency under neutral conditions, not investment advice. The fact that 79% of value storage scenarios favored Bitcoin indicates AI systems tend to regard Bitcoin as a core reference asset when evaluating currency properties. However, individual investment decisions still need to consider specific risk contexts.
Disclaimer: The information on this page may come from third parties and does not represent the views or opinions of Gate. The content displayed on this page is for reference only and does not constitute any financial, investment, or legal advice. Gate does not guarantee the accuracy or completeness of the information and shall not be liable for any losses arising from the use of this information. Virtual asset investments carry high risks and are subject to significant price volatility. You may lose all of your invested principal. Please fully understand the relevant risks and make prudent decisions based on your own financial situation and risk tolerance. For details, please refer to
Disclaimer.
Related Articles
CryptoQuant Reveals Ethereum's "Adoption Paradox": Users Double While Funds Flee, ETH Could Plunge to $1500 by Year-End
Ethereum's activity reaches an all-time high, but price falls sharply due to fund outflows, with realized value turning negative. If the bear market continues, ETH is predicted to potentially drop to $1,500. Analysis indicates that network usage growth cannot support asset performance, and Layer 2 scaling poses pressure on ETH. The market shows significant divergence over Ethereum's future value.
動區BlockTempo11m ago
TOTAL2 Retests Historic Support — 4 Altcoins Traders Are Watching for Potential 50x Upside
TOTAL2 has returned to a historic support zone that previously triggered major altcoin expansions.
Chainlink, Ondo, Render, and Solana continue attracting attention due to infrastructure growth.
Real-world assets, GPU computing, and high-throughput networks remain key
CryptoNewsLand21m ago
Bitcoin Strong Rebound to 72,033 USD, Short Positions Liquidated 178 Million, Gold Decline Reveals "Risk-Off Rotation"
Bitcoin surged to 72,033 USD this morning, then pulled back slightly to 71,682 USD, while Ethereum broke through 2,100 USD, reaching a high of 2,150 USD. The futures market saw 256 million USD in liquidations over 24 hours, with short positions being primarily closed. Risk-off capital is shifting from gold to crypto assets, indicating a reallocation of funds. Analysts point out that if Bitcoin can hold steady above 72,000 USD, it could rally further, while instability could lead to a retest of 68,500 USD.
動區BlockTempo22m ago
JPMorgan: After Iran War, ETF Funds Diverge, Gold Loses Favor as Bitcoin Sees Inflows
JPMorgan's report indicates that since the Iran war, there has been a significant divergence in fund flows between Bitcoin and gold ETFs, with gold ETF (GLD) experiencing outflows of approximately 2.7%, while Bitcoin ETF (IBIT) attracting 1.5% inflows. Analysis shows that institutional investors are reducing Bitcoin exposure while increasing gold holdings, IBIT's options strategies are becoming increasingly complex, and Bitcoin's volatility is narrowing, indicating improving market structure.
MarketWhisper42m ago
Why Did Bitcoin Rise Today? Gold Safe-Haven Sentiment Easing, Institutions See Net Inflows for Third Consecutive Week into Digital Assets
Since the end of February when the U.S.-Israel coalition bombed Iran, Bitcoin's price has risen approximately 6%, outperforming both gold and U.S. stocks. Institutional investors continue to contribute positive net inflows to digital assets, demonstrating Bitcoin's appeal as a safe-haven asset. As U.S. Treasury yields rise, the safety perception of traditional safe-haven assets faces challenges, while Bitcoin benefits from its non-sovereign nature. Technical analysis indicates $72,000 as a key resistance level, with potential for further gains upon a breakout.
MarketWhisper47m ago
CryptoQuant: Ethereum Faces "Adoption Paradox," ETH Could Drop to $1,500
Ethereum is facing an "adoption paradox," with network activity reaching all-time highs while ETH price has declined significantly. CryptoQuant analysis indicates that if the bear market persists, ETH could fall to $1,500. The relationship between exchange inflows and price dynamics is more pronounced, suggesting ETH is facing strong selling pressure.
GateNews1h ago