#DeFiLossesTop600MInApril
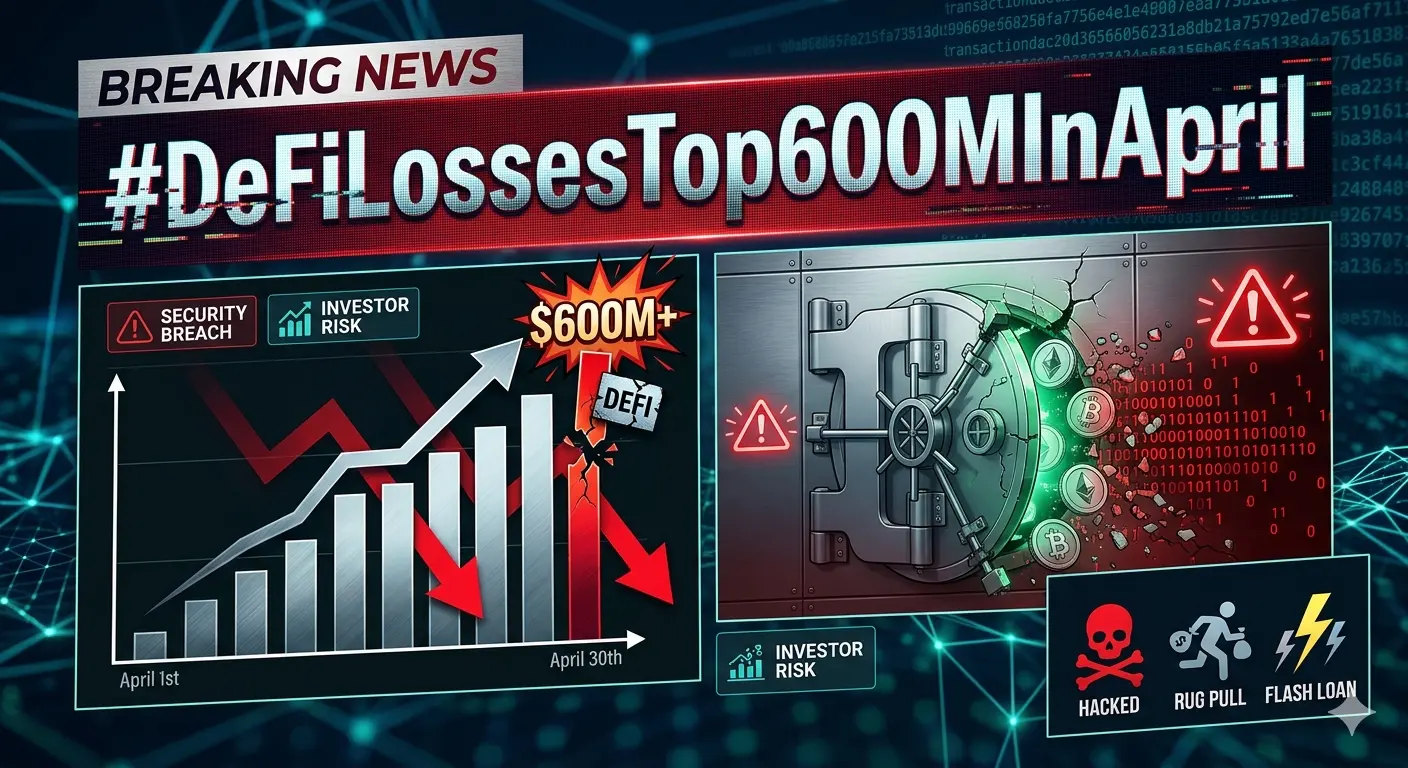
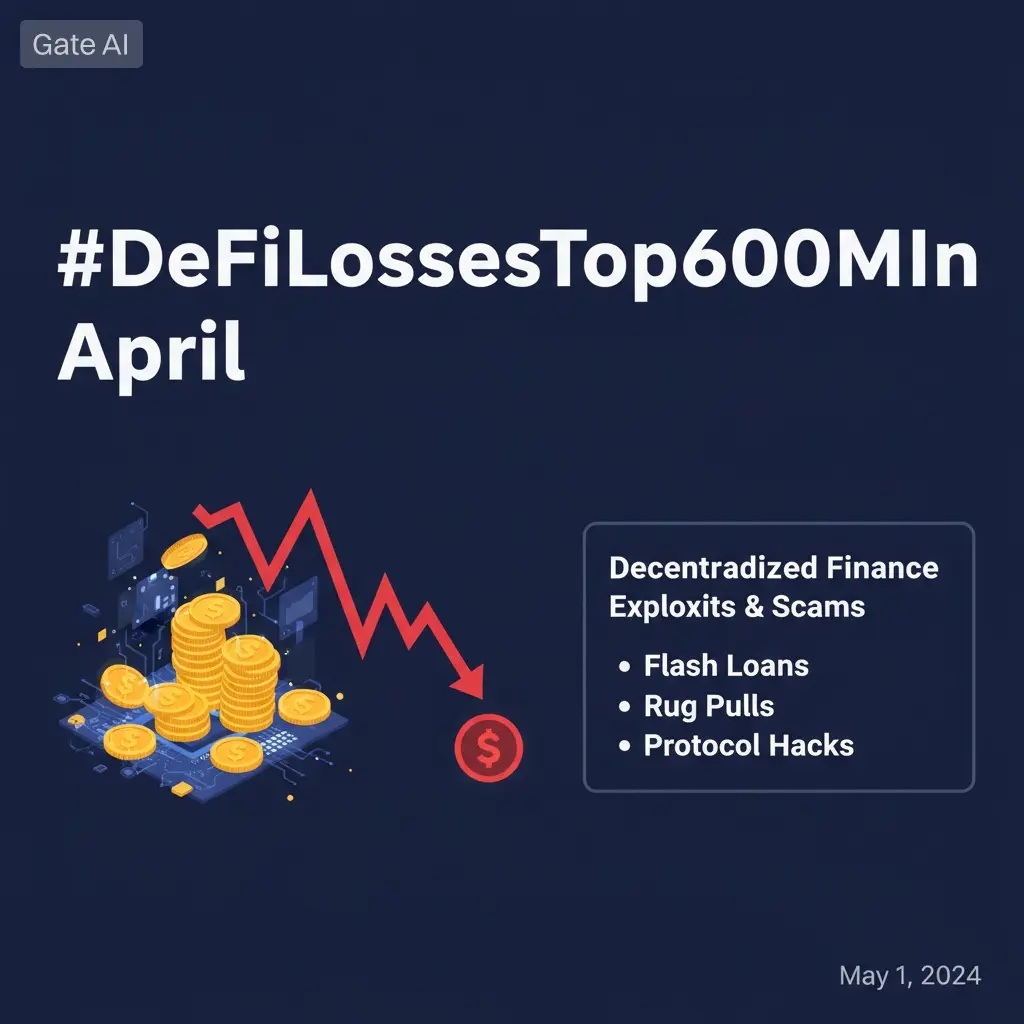
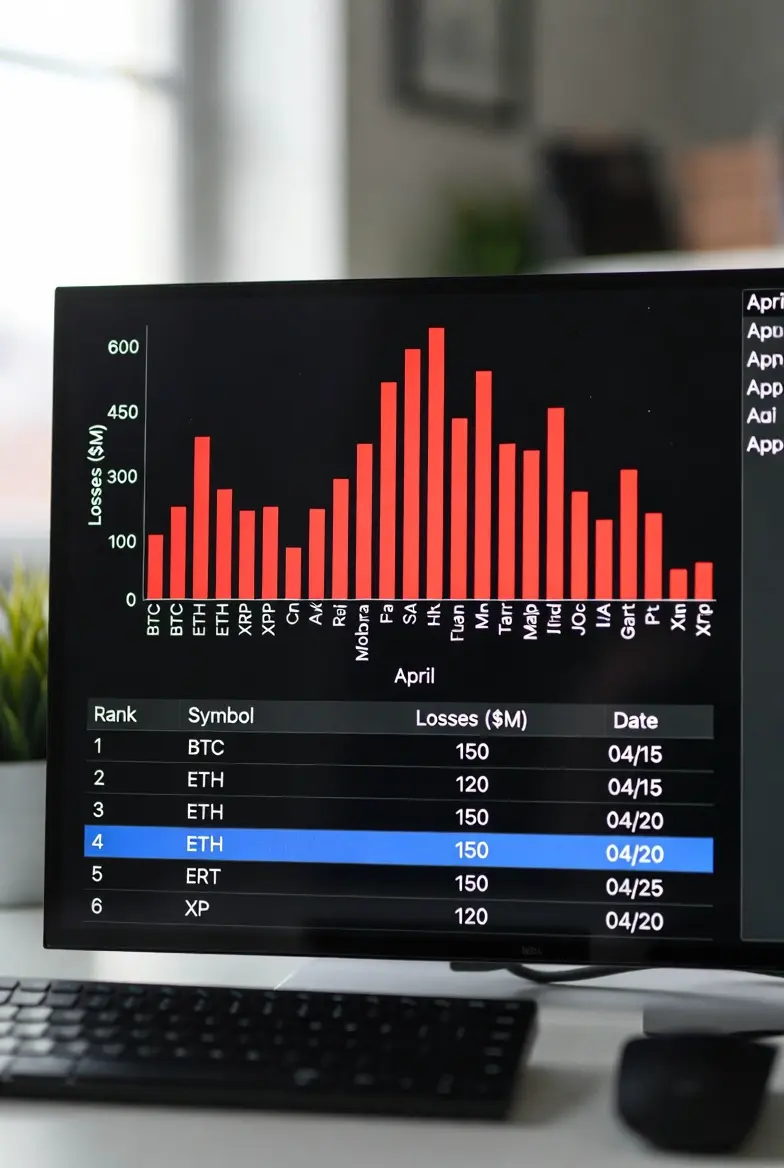
DeFi Losses Exceed $600 Million in April
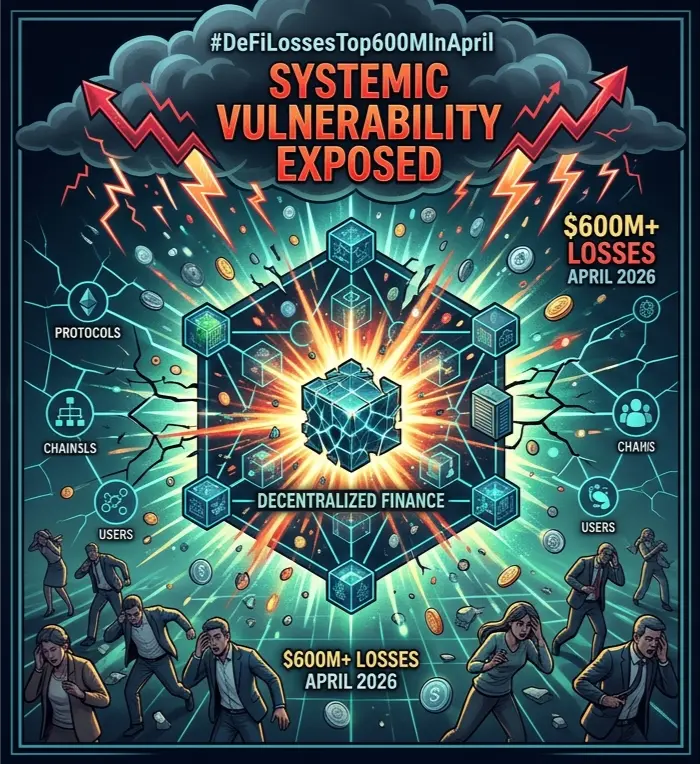
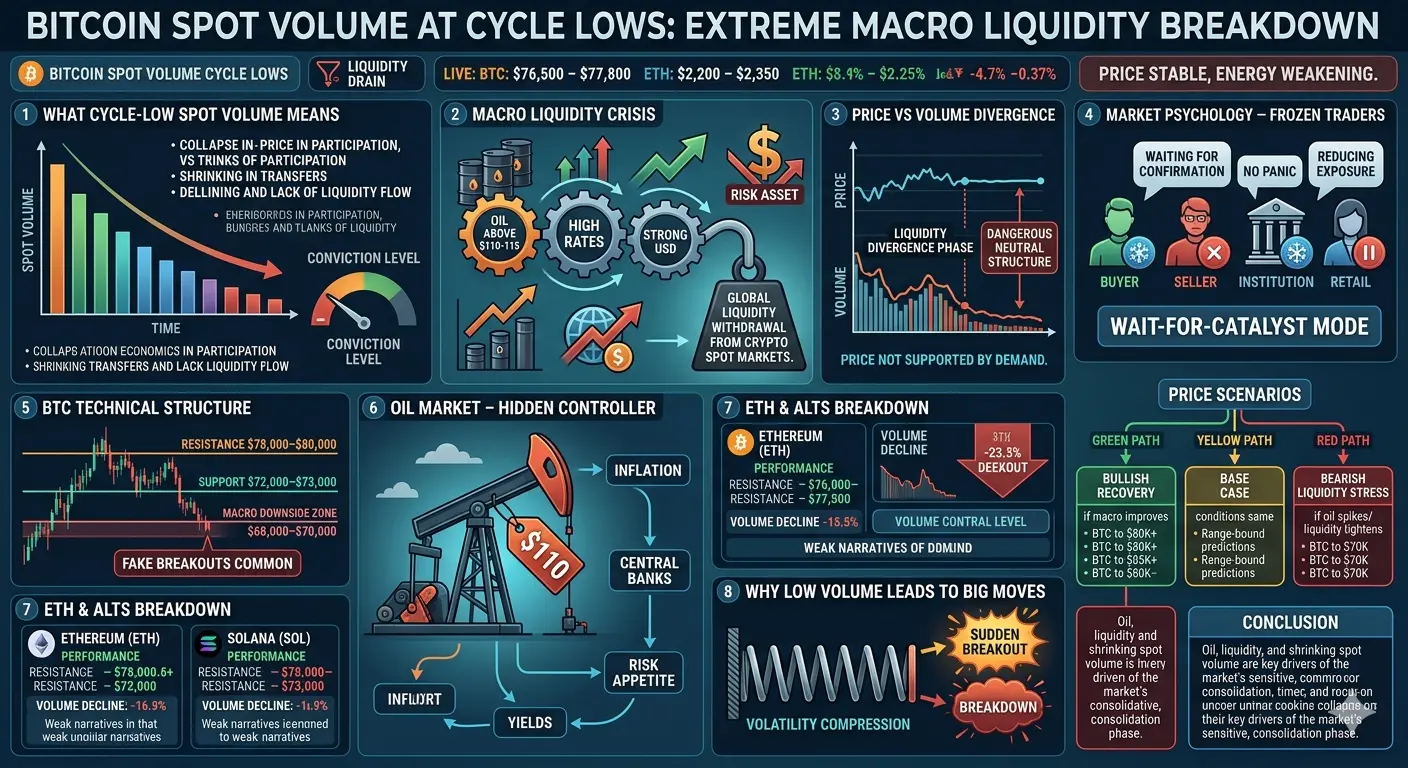
The April 2026 DeFi crisis, resulting in more than $600 million in direct losses, created significant structural stress within decentralized finance protocols and triggered measurable price reactions across the broader crypto market.
Even though DeFi represents a smaller share of total crypto market capitalization compared to Bitcoin and Ethereum, its impact on liquidity confidence and risk sentiment remains disproportionately large. As a result, shocks in this sector continue to influence broader volatility across digital asset markets.
📊 Current Market Snapshot (Updated Prices)
Bitcoin (BTC): $76,608
Ethereum (ETH): $2,264
Solana (SOL): $84
📉 Updated Price Impact Across Major Crypto Assets
Following the DeFi exploit wave in April, the market displayed differentiated reactions across key assets:
🟠 Bitcoin (BTC)
Bitcoin remained relatively stable, trading around $75,800 to $77,200, now consolidating near $76,608.
Overall movement: approximately -1% to -3%
Interpretation: BTC continues acting as a macro liquidity anchor rather than a DeFi-exposed asset
🔵 Ethereum (ETH)
Ethereum experienced more noticeable downside pressure due to its deep integration with DeFi ecosystems.
Current range: $2,200 to $2,350
Trading near: $2,264
Overall movement: approximately -4% to -8%
Key driver: direct exposure to smart contract liquidity and DeFi-linked collateral flows
🟡 Solana (SOL)
Solana reflected higher beta behavior due to ecosystem sensitivity and liquidity outflows.
Current range: $78 to $90
Trading near: $84
Overall movement: approximately -5% to -12%
Driver: infrastructure-linked sentiment pressure and DeFi ecosystem correlation
🟣 DeFi Sector Tokens
DeFi tokens collectively experienced the sharpest impact:
Declines: -8% to -18%
Some mid-cap governance tokens saw intraday volatility exceeding -20%
Main driver: trust erosion and liquidity withdrawal cycles
🟢 Stablecoins
Stablecoins remained price-stable but showed significant behavioral shifts:
Inflows increased by approximately +12% to +25%
Interpretation: capital rotation into lower-risk storage within crypto markets
🌊 Market Structure Impact – Liquidity Rotation Behavior
The key shift post-$600M DeFi losses was not just price decline but capital reallocation dynamics:
High-risk DeFi protocols → sharp outflows
Mid-cap altcoins → moderate exposure reduction
Ethereum → partial defensive positioning
Bitcoin → relative accumulation zone
Stablecoins → temporary capital parking
This created a liquidity compression cycle, where DeFi Total Value Locked (TVL) declined approximately 4% to 7%, while stablecoin settlement activity and exchange inflows increased.
📊 Volatility Transmission – Why DeFi Losses Affect Prices
DeFi shocks propagate beyond their direct financial impact due to confidence-driven leverage mechanisms:
Reduction in leveraged positions across lending platforms
Collateral value decline triggering partial liquidations
Temporary liquidity withdrawal from market makers
Risk model recalibration across protocols
Shift from yield-seeking behavior to capital preservation
This creates a second-order effect where a $600M loss can influence $2–5 billion in total market repositioning across spot and derivatives markets.
📉 Sector Performance Divergence
A clear structural divergence remains visible:
Bitcoin: low volatility macro hedge (~2% deviation range)
Ethereum: hybrid exposure asset with moderate DeFi correlation
DeFi tokens: high-beta instruments with amplified drawdowns (3x–5x BTC volatility)
This reinforces crypto’s evolving segmentation:
Macro assets → BTC, partially ETH
Infrastructure assets → ETH ecosystem, L2 networks
High-risk yield assets → DeFi protocols and experimental finance layers
🔄 Liquidity Recovery Behavior Post-Crisis
Historically, DeFi shocks follow a three-phase cycle:
Panic phase (0–72 hours): rapid withdrawals
Stabilization phase (3–10 days): selective re-entry
Redistribution phase (2–6 weeks): capital flows into safer protocols
Early indicators suggest the market is transitioning from Phase 1 into Phase 2, with:
Stabilizing DeFi TVL
Rising stablecoin inflows to exchanges
Gradual normalization of liquidity conditions
🌍 Broader Market Interpretation
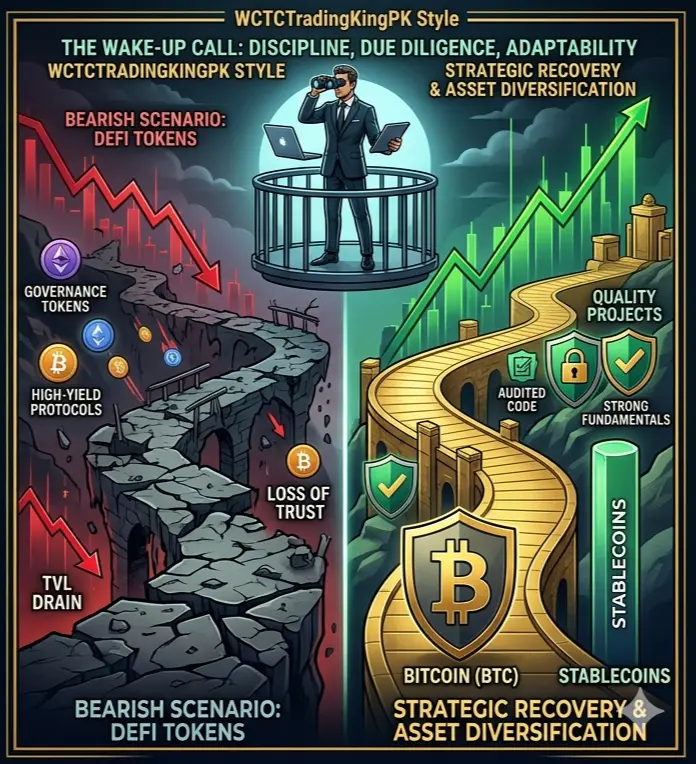
The $600M DeFi loss event should be viewed not as systemic collapse but as a stress test of decentralized financial infrastructure.
Key takeaways:
DeFi is now large enough to influence macro liquidity cycles
Capital rotation dominates over full market exits
Bitcoin increasingly functions as a crypto-native macro settlement asset
🔮 Forward Outlook – Price Stability vs Expansion Potential
If no additional major exploits occur:
DeFi assets may recover +5% to +15% from post-crisis lows
Bitcoin could stabilize and potentially retest $78,000–$82,000
Ethereum may lead recovery with upside potential of +8% to +18%, depending on liquidity normalization
Solana could gradually recover toward $90–$100 range if ecosystem sentiment improves
However, renewed vulnerabilities could temporarily trigger another 5%–10% sector-wide correction in DeFi assets.
📌 Final Summary
The April 2026 DeFi crisis exceeding $600 million in losses produced a clear but contained shock across crypto markets.
BTC: stable near $76,608
ETH: under moderate pressure near $2,264
SOL: fluctuating around $84
DeFi tokens: highest volatility with up to -18% drawdowns
Despite short-term disruption, market structure remains resilient, with capital rotating rather than exiting—indicating a maturing, segmented crypto financial system.
DeFi Losses Exceed $600 Million in April
The April 2026 DeFi crisis, resulting in more than $600 million in direct losses, created significant structural stress within decentralized finance protocols and triggered measurable price reactions across the broader crypto market.
Even though DeFi represents a smaller share of total crypto market capitalization compared to Bitcoin and Ethereum, its impact on liquidity confidence and risk sentiment remains disproportionately large. As a result, shocks in this sector continue to influence broader volatility across digital asset markets.
📊 Current Market Snapshot (Updated Prices)
Bitcoin (BTC): $76,608
Ethereum (ETH): $2,264
Solana (SOL): $84
📉 Updated Price Impact Across Major Crypto Assets
Following the DeFi exploit wave in April, the market displayed differentiated reactions across key assets:
🟠 Bitcoin (BTC)
Bitcoin remained relatively stable, trading around $75,800 to $77,200, now consolidating near $76,608.
Overall movement: approximately -1% to -3%
Interpretation: BTC continues acting as a macro liquidity anchor rather than a DeFi-exposed asset
🔵 Ethereum (ETH)
Ethereum experienced more noticeable downside pressure due to its deep integration with DeFi ecosystems.
Current range: $2,200 to $2,350
Trading near: $2,264
Overall movement: approximately -4% to -8%
Key driver: direct exposure to smart contract liquidity and DeFi-linked collateral flows
🟡 Solana (SOL)
Solana reflected higher beta behavior due to ecosystem sensitivity and liquidity outflows.
Current range: $78 to $90
Trading near: $84
Overall movement: approximately -5% to -12%
Driver: infrastructure-linked sentiment pressure and DeFi ecosystem correlation
🟣 DeFi Sector Tokens
DeFi tokens collectively experienced the sharpest impact:
Declines: -8% to -18%
Some mid-cap governance tokens saw intraday volatility exceeding -20%
Main driver: trust erosion and liquidity withdrawal cycles
🟢 Stablecoins
Stablecoins remained price-stable but showed significant behavioral shifts:
Inflows increased by approximately +12% to +25%
Interpretation: capital rotation into lower-risk storage within crypto markets
🌊 Market Structure Impact – Liquidity Rotation Behavior
The key shift post-$600M DeFi losses was not just price decline but capital reallocation dynamics:
High-risk DeFi protocols → sharp outflows
Mid-cap altcoins → moderate exposure reduction
Ethereum → partial defensive positioning
Bitcoin → relative accumulation zone
Stablecoins → temporary capital parking
This created a liquidity compression cycle, where DeFi Total Value Locked (TVL) declined approximately 4% to 7%, while stablecoin settlement activity and exchange inflows increased.
📊 Volatility Transmission – Why DeFi Losses Affect Prices
DeFi shocks propagate beyond their direct financial impact due to confidence-driven leverage mechanisms:
Reduction in leveraged positions across lending platforms
Collateral value decline triggering partial liquidations
Temporary liquidity withdrawal from market makers
Risk model recalibration across protocols
Shift from yield-seeking behavior to capital preservation
This creates a second-order effect where a $600M loss can influence $2–5 billion in total market repositioning across spot and derivatives markets.
📉 Sector Performance Divergence
A clear structural divergence remains visible:
Bitcoin: low volatility macro hedge (~2% deviation range)
Ethereum: hybrid exposure asset with moderate DeFi correlation
DeFi tokens: high-beta instruments with amplified drawdowns (3x–5x BTC volatility)
This reinforces crypto’s evolving segmentation:
Macro assets → BTC, partially ETH
Infrastructure assets → ETH ecosystem, L2 networks
High-risk yield assets → DeFi protocols and experimental finance layers
🔄 Liquidity Recovery Behavior Post-Crisis
Historically, DeFi shocks follow a three-phase cycle:
Panic phase (0–72 hours): rapid withdrawals
Stabilization phase (3–10 days): selective re-entry
Redistribution phase (2–6 weeks): capital flows into safer protocols
Early indicators suggest the market is transitioning from Phase 1 into Phase 2, with:
Stabilizing DeFi TVL
Rising stablecoin inflows to exchanges
Gradual normalization of liquidity conditions
🌍 Broader Market Interpretation
The $600M DeFi loss event should be viewed not as systemic collapse but as a stress test of decentralized financial infrastructure.
Key takeaways:
DeFi is now large enough to influence macro liquidity cycles
Capital rotation dominates over full market exits
Bitcoin increasingly functions as a crypto-native macro settlement asset
🔮 Forward Outlook – Price Stability vs Expansion Potential
If no additional major exploits occur:
DeFi assets may recover +5% to +15% from post-crisis lows
Bitcoin could stabilize and potentially retest $78,000–$82,000
Ethereum may lead recovery with upside potential of +8% to +18%, depending on liquidity normalization
Solana could gradually recover toward $90–$100 range if ecosystem sentiment improves
However, renewed vulnerabilities could temporarily trigger another 5%–10% sector-wide correction in DeFi assets.
📌 Final Summary
The April 2026 DeFi crisis exceeding $600 million in losses produced a clear but contained shock across crypto markets.
BTC: stable near $76,608
ETH: under moderate pressure near $2,264
SOL: fluctuating around $84
DeFi tokens: highest volatility with up to -18% drawdowns
Despite short-term disruption, market structure remains resilient, with capital rotating rather than exiting—indicating a maturing, segmented crypto financial system.